The 2017 summer solstice near Coldfoot, above the Arctic Circle. Land of the midnight sun.
““Knowing where things are, and why, is essential to rational decision making””
Project dates: 2018-2026
Project 1: 2019-2022. Mapping ecological impacts of increasing fires, and exploring ultra high frequency fires
Project 2: 2022-2026. Linking fire caused changes to 1000+ years of ecosystem health, and building educational models
The spatial pattern of disturbance events is commonly analyzed to estimate ecological effects. However, we can go a step further by analyzing the spatial pattern of disturbance drivers to get landscape and regional estimates of the effects of disturbance regimes, meaning the cumulative effect of a disturbance-ecological system. This is far more powerful, but requires considerable number crunching. One example is our analysis of multiple disturbances on water resources across the lower 48. A second would be the 20 degree of latitude analysis of an emergent, climate driven disturbance process not seen at broad scales before.
An exciting current project is exploring the effects of multiple, overlapping fires in boreal forests. Two interval fires have been studied before, and generally all point to similar conclusions as our study in the Routt National Forest - lowered resilience, increased establishment of deciduous trees, and lower carbon. But two is a coincidence, three fires begins to point towards a new normal - and indeed, the projections for the boreal in the future point towards fire return intervals of <100 years, or even <50. What will that look like? There's plenty of modeling studies, but no on the ground data - until now.
Together with Katherine Hayes (University of Colorado Denver PhD student in the lab), Dr. Melissa Lucash (Portland State), Dr. Jason Vogel (University of Florida), Dr. Tim Link (University of Idaho), and Dr. Vladimir Romanovsky (University of Alaska Fairbanks), we are exploring what 3 fires, a regular fire regime, means for the boreal. In 2018 we completed extensive fieldwork, stratifying a carbon and regeneration survey across unburned, 1, 2, and 3 fire burn areas. In each plot we quantified all pools of carbon, and took quite a few samples for determination of previous species composition. We are also using historical aerial photography to determine the precise series of succession post (each) disturbance.
We are now working with Dr. Phil Higuera at the University of Montana to tie our findings to the 1000+ paleo history of the region recorded in lake sediments, and Dr. Chad Hoffman (CSU) to link fire behavior to new and emerging fluid-dynamics based fire models, for better prediction. We are also building a new educational model for secondary students with the Concord Consortium.

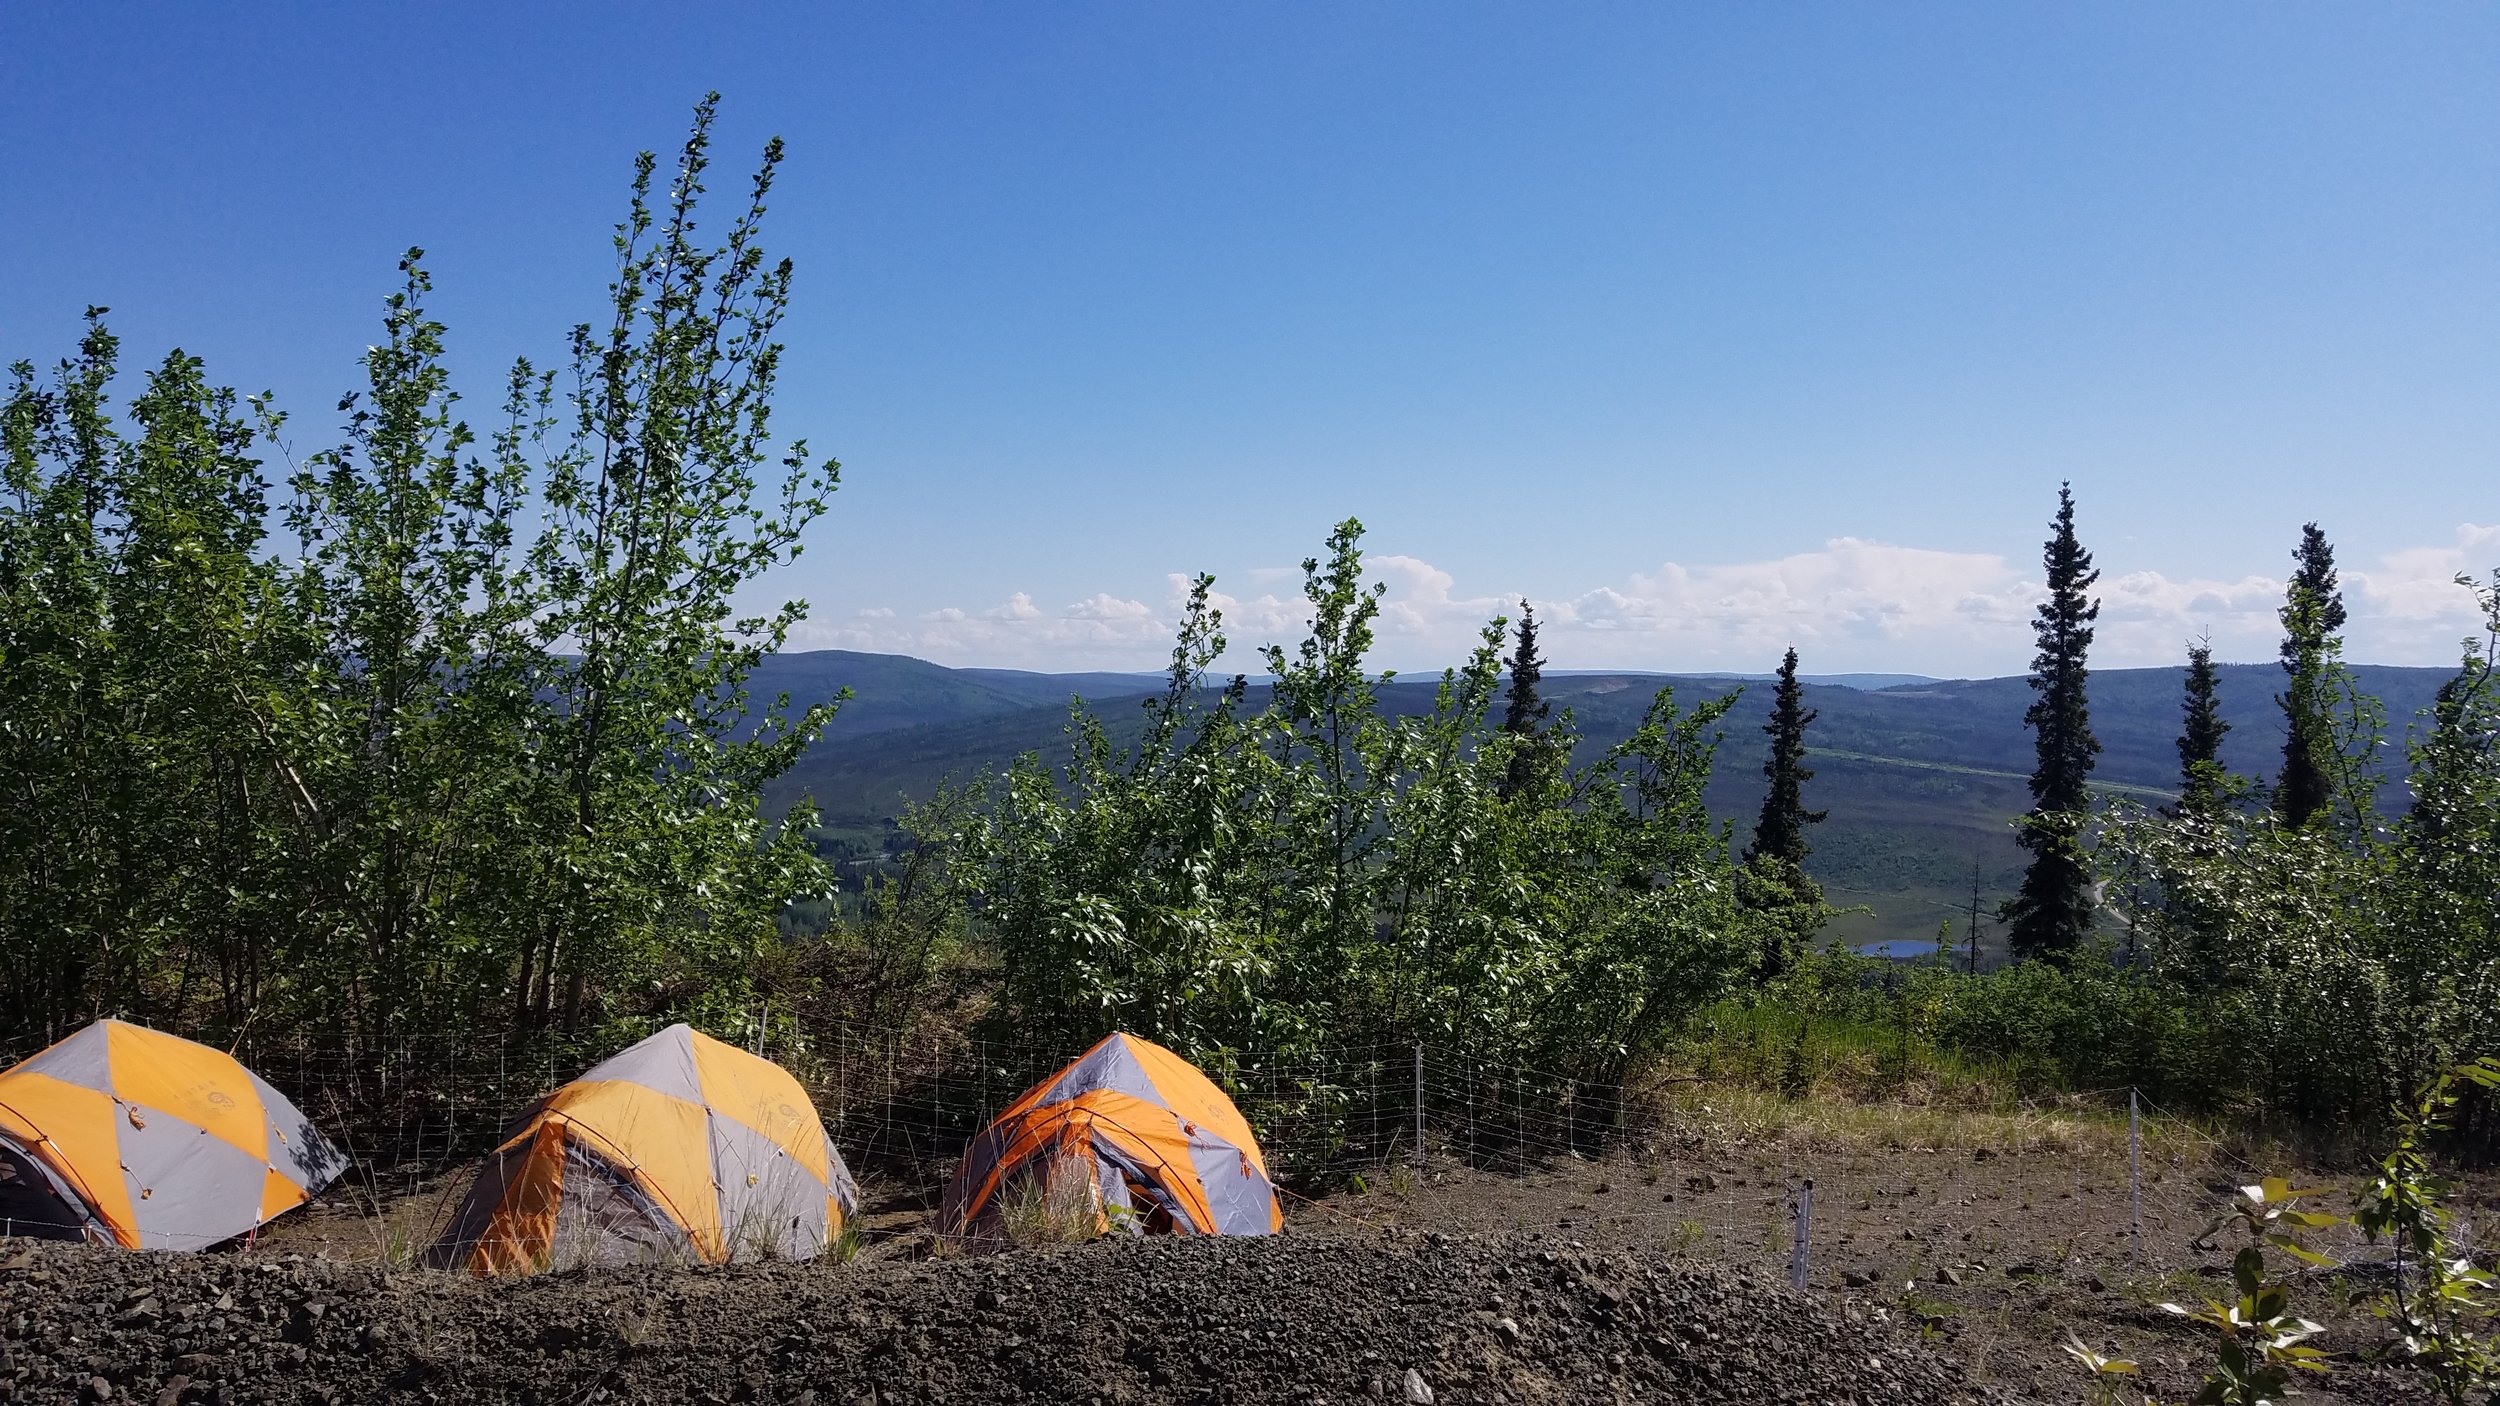
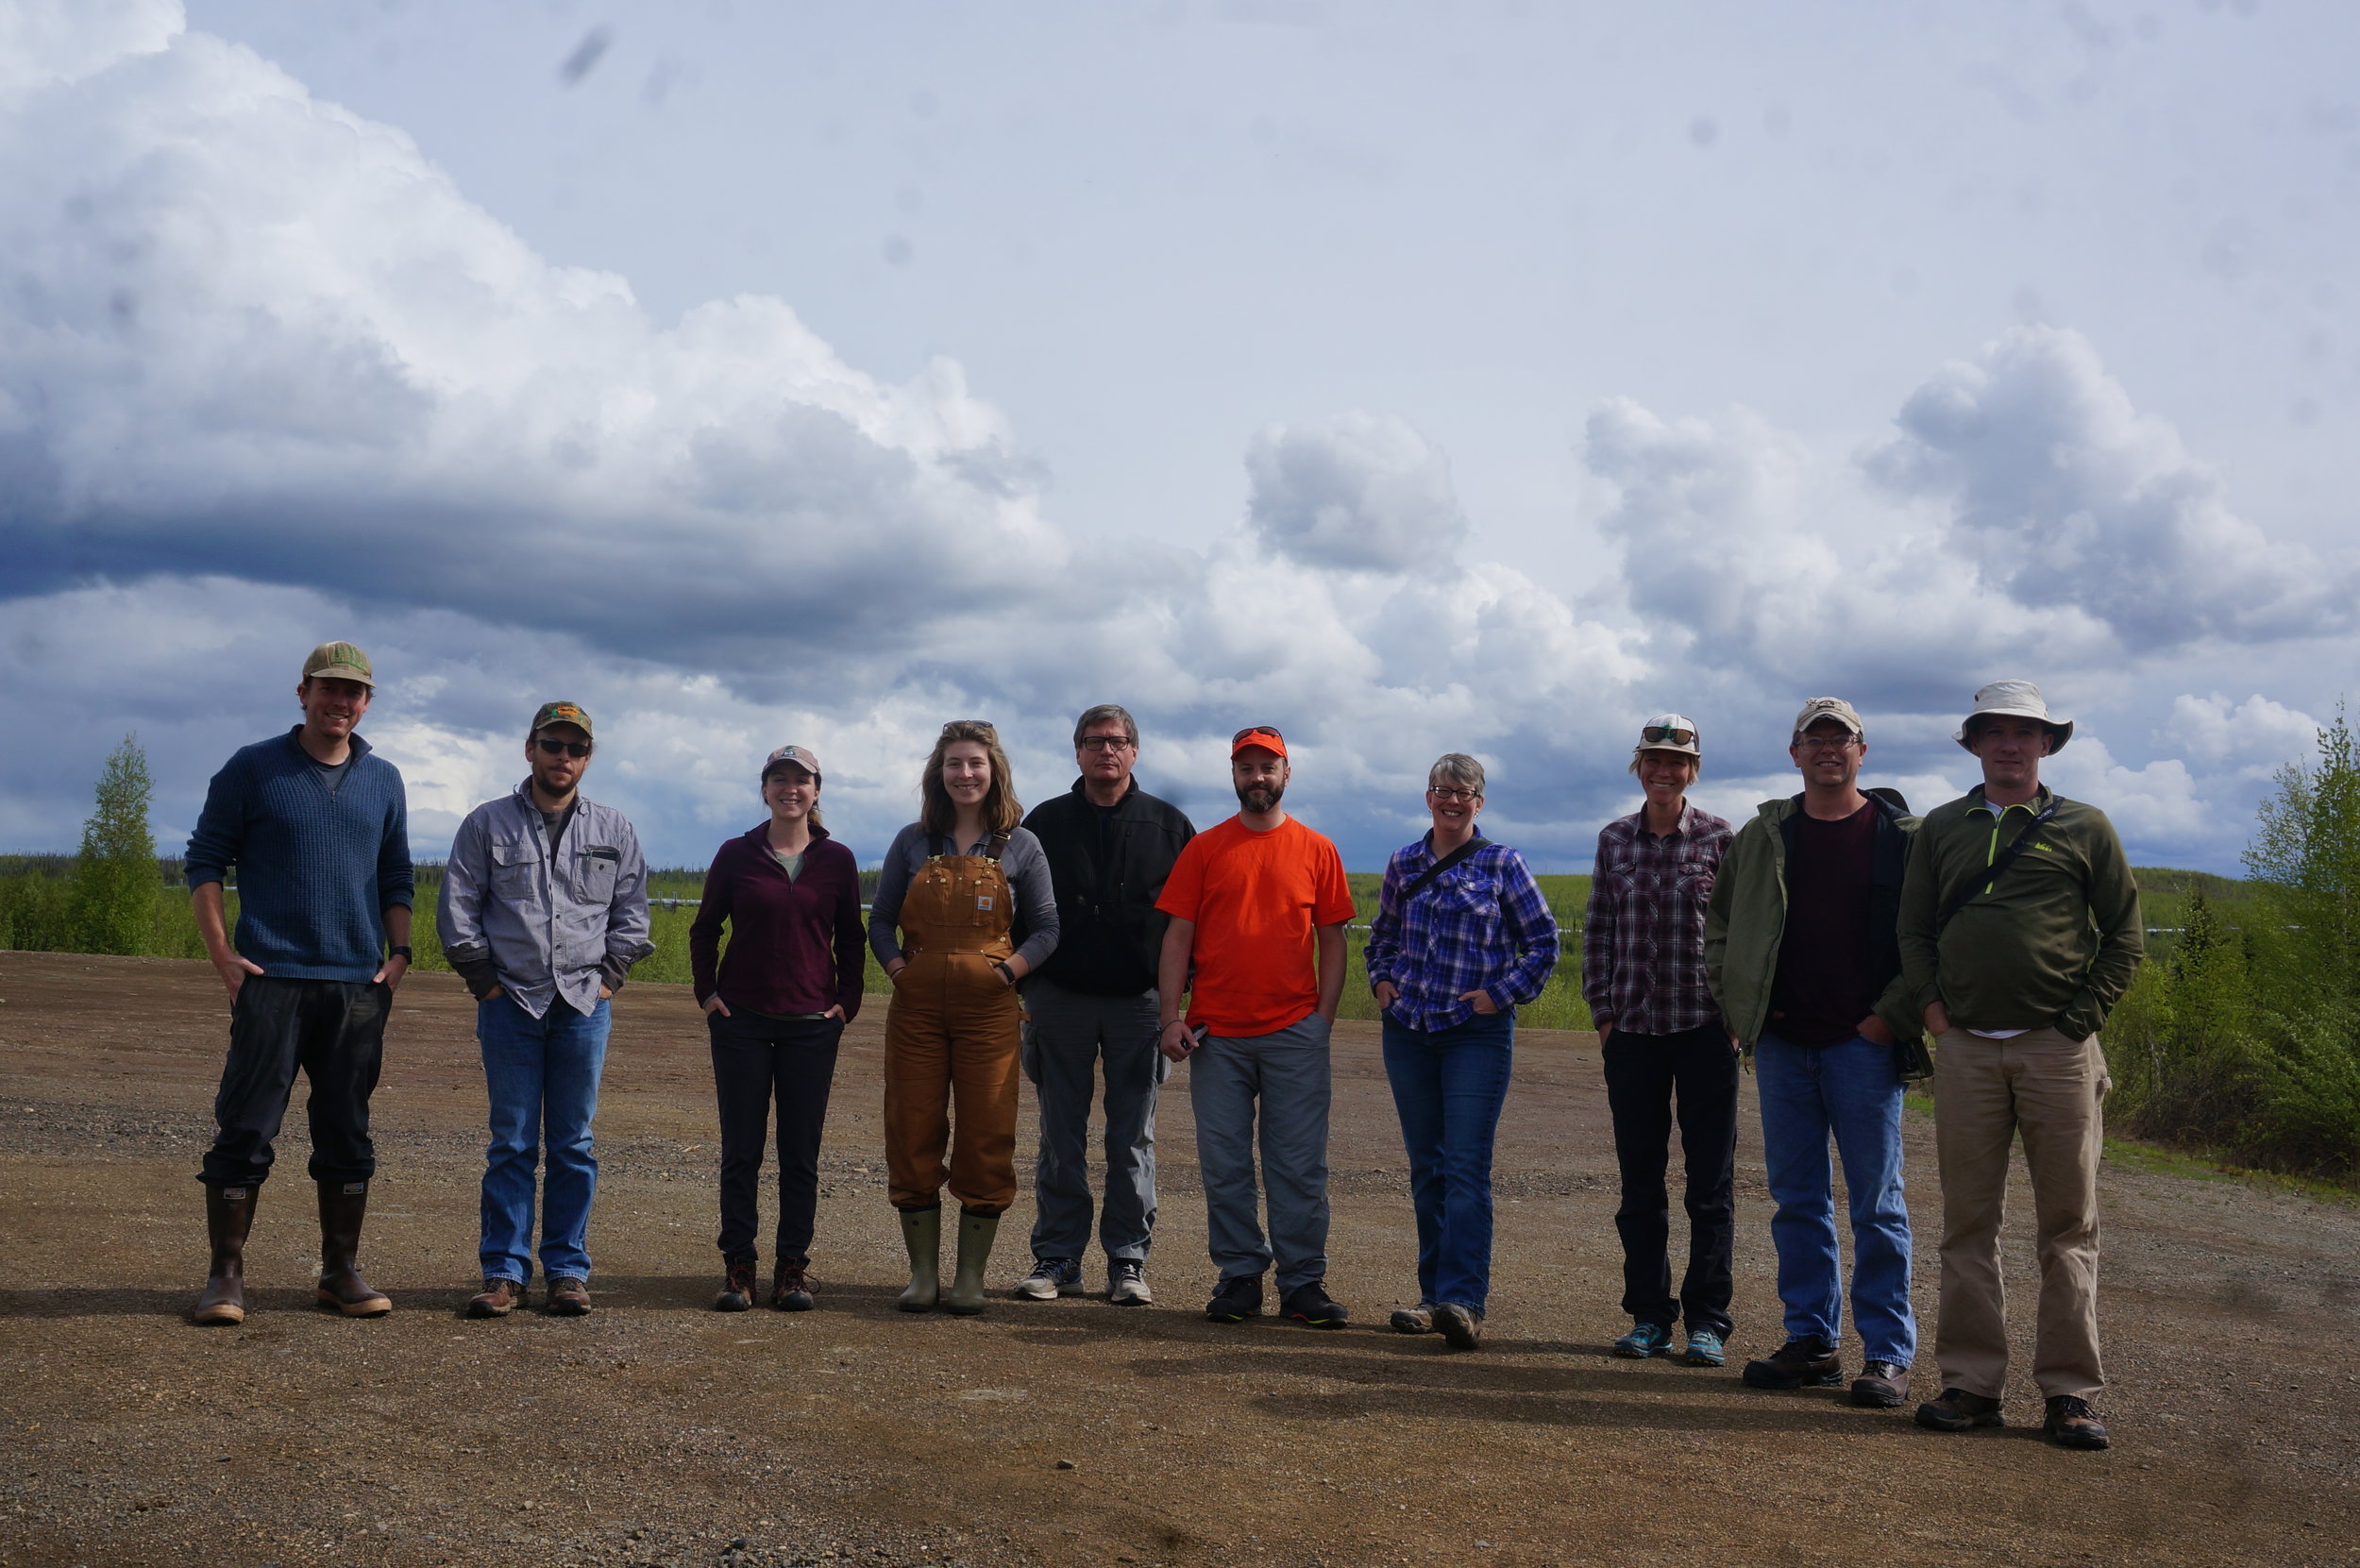
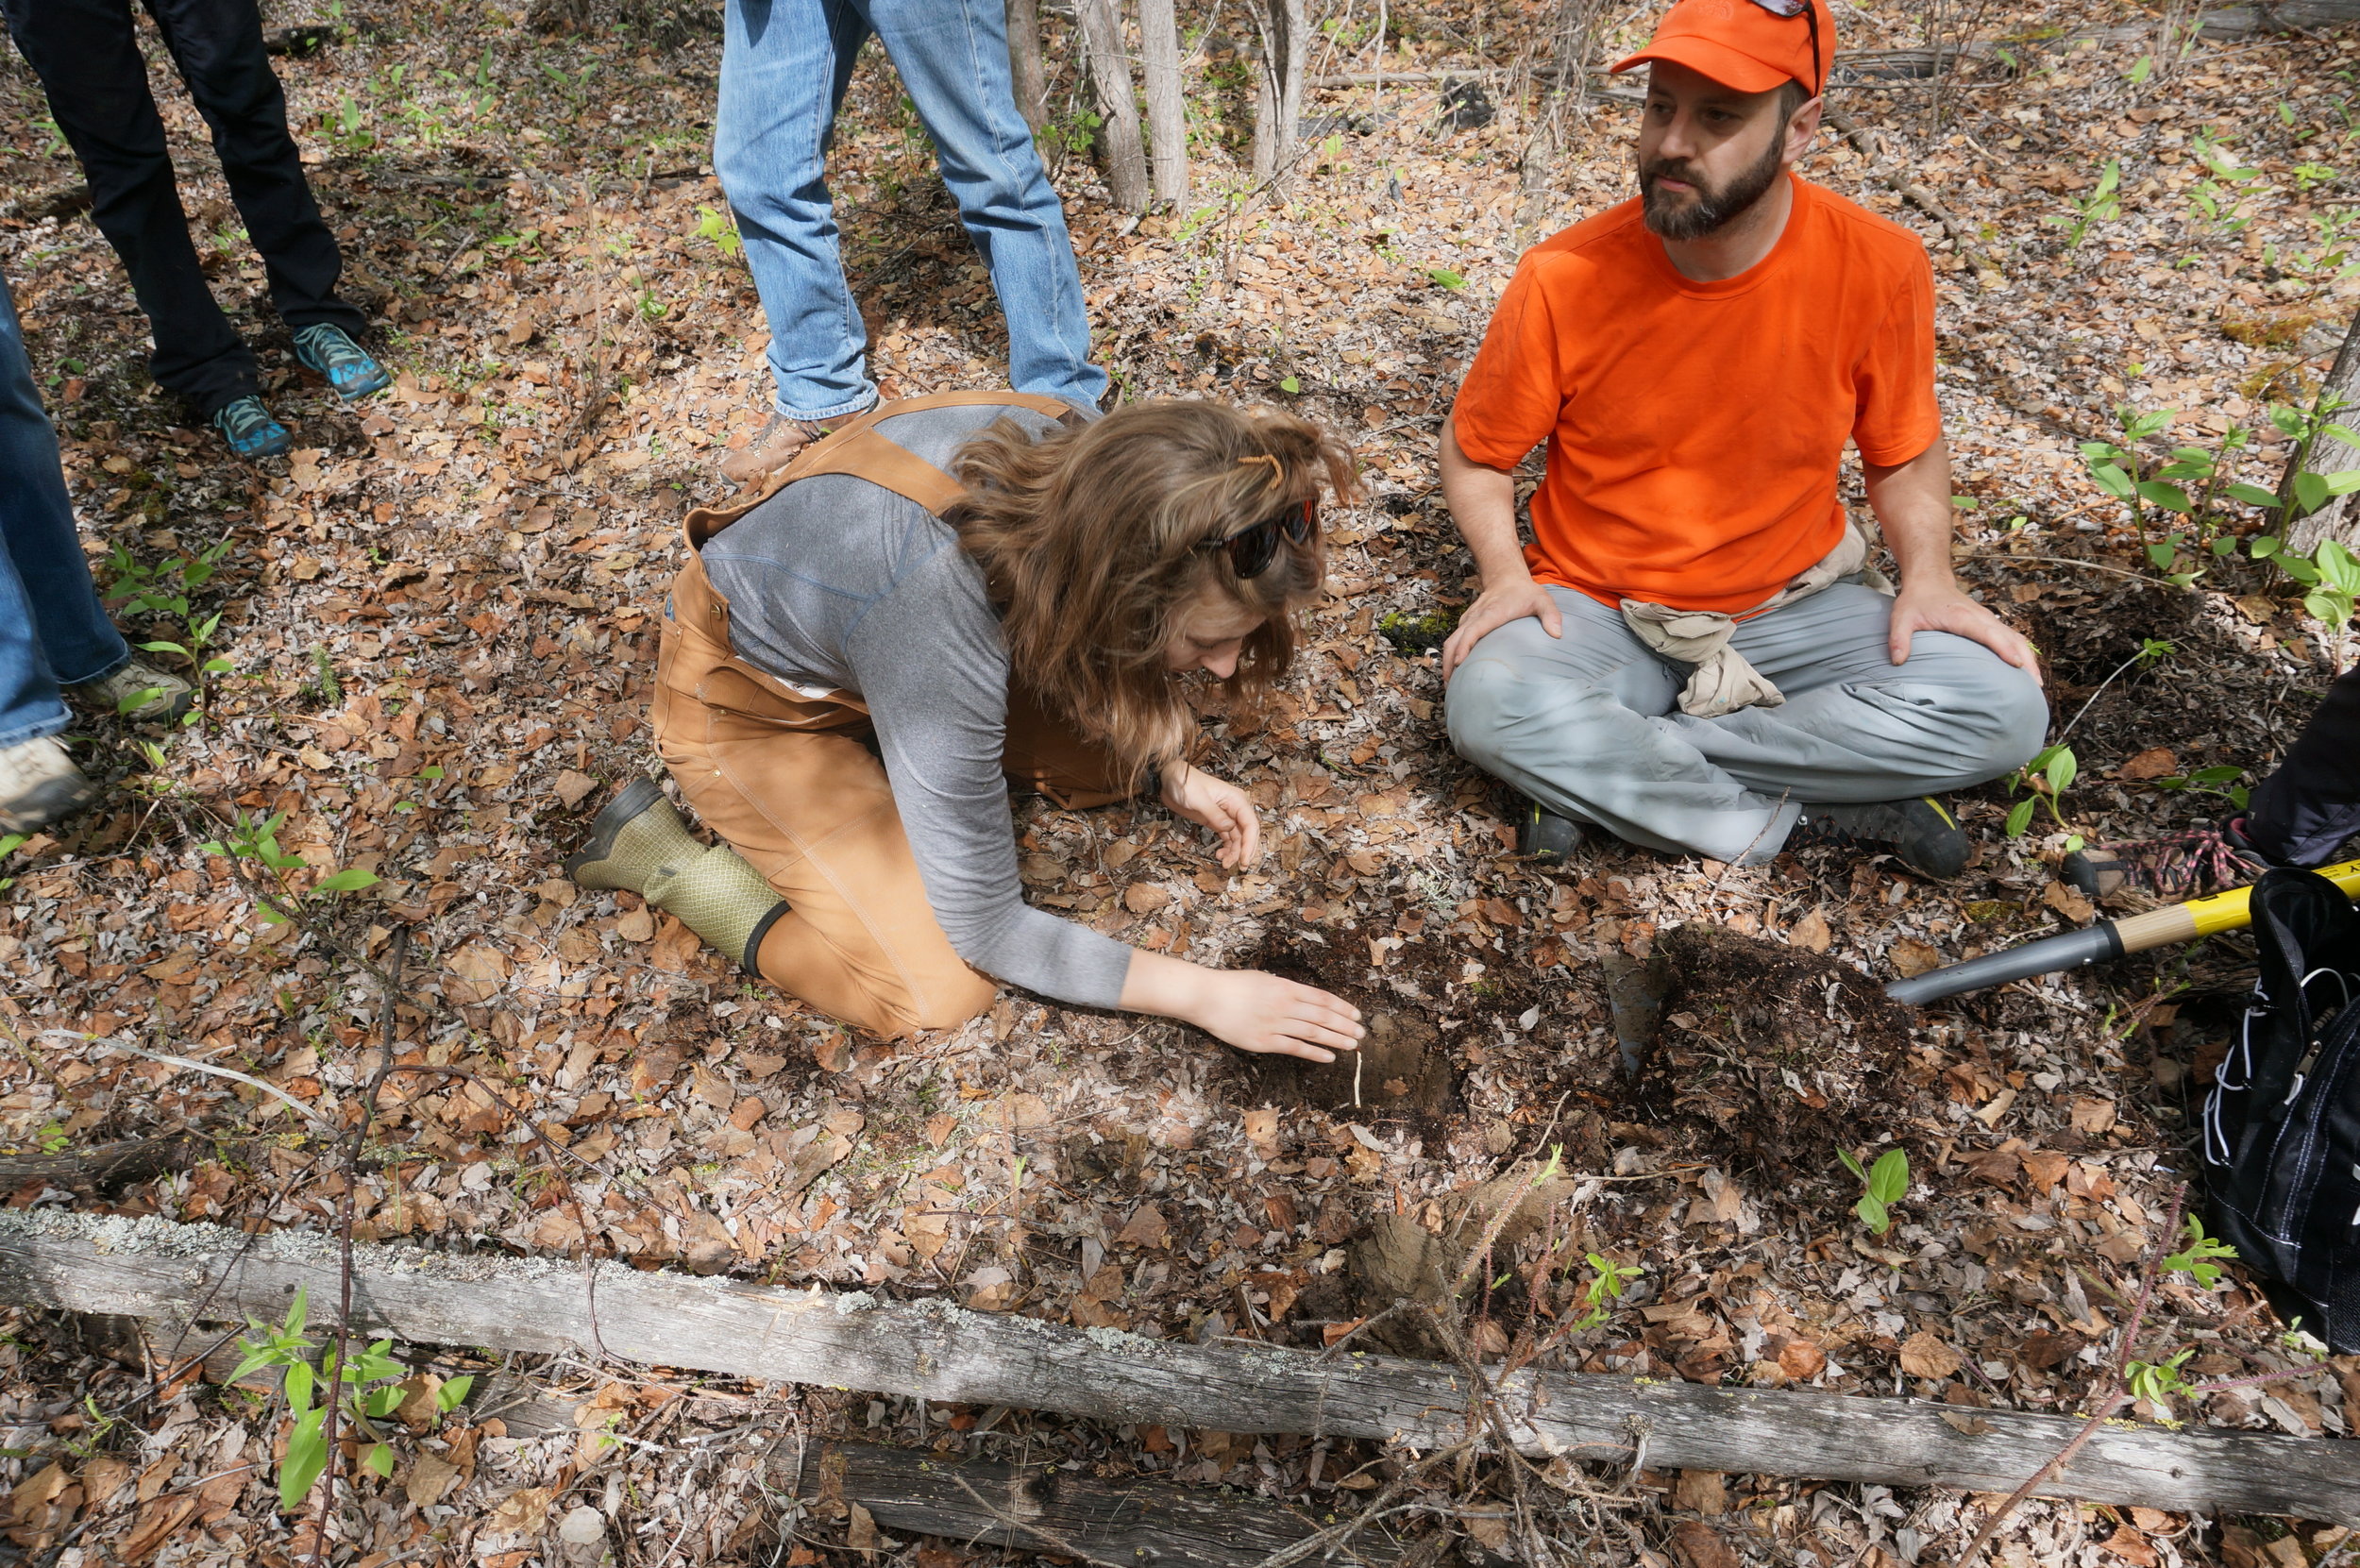

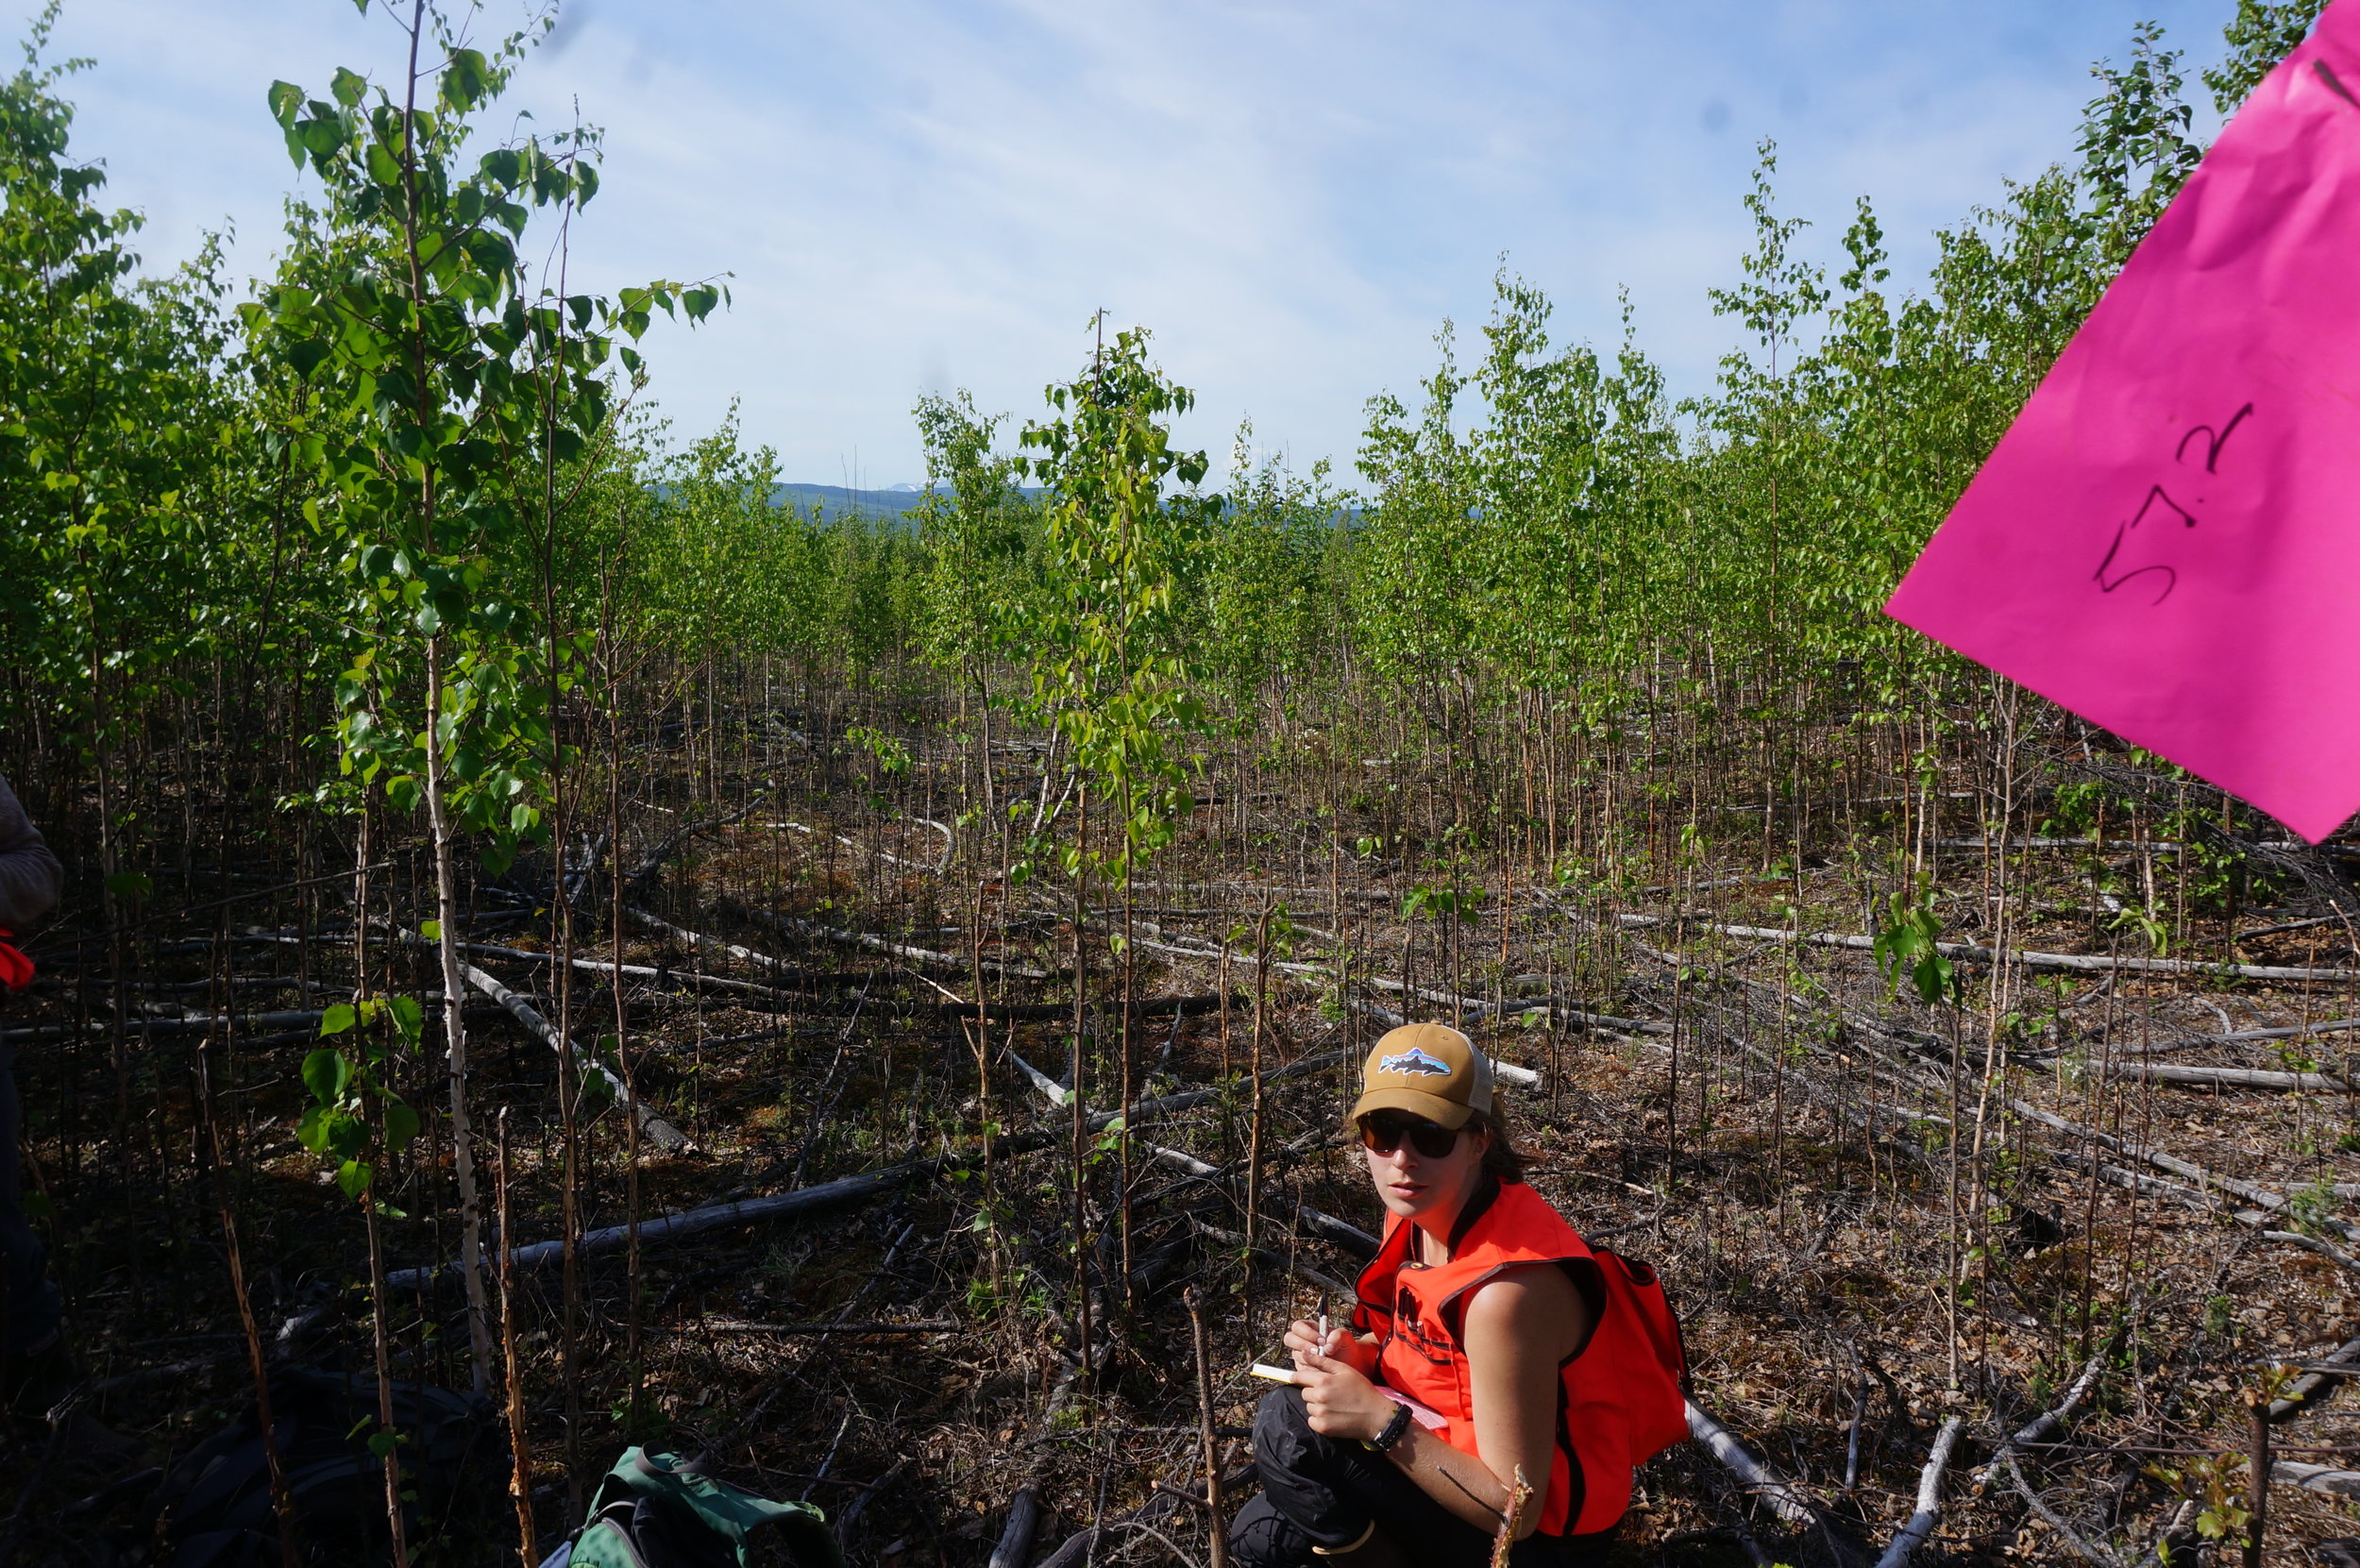
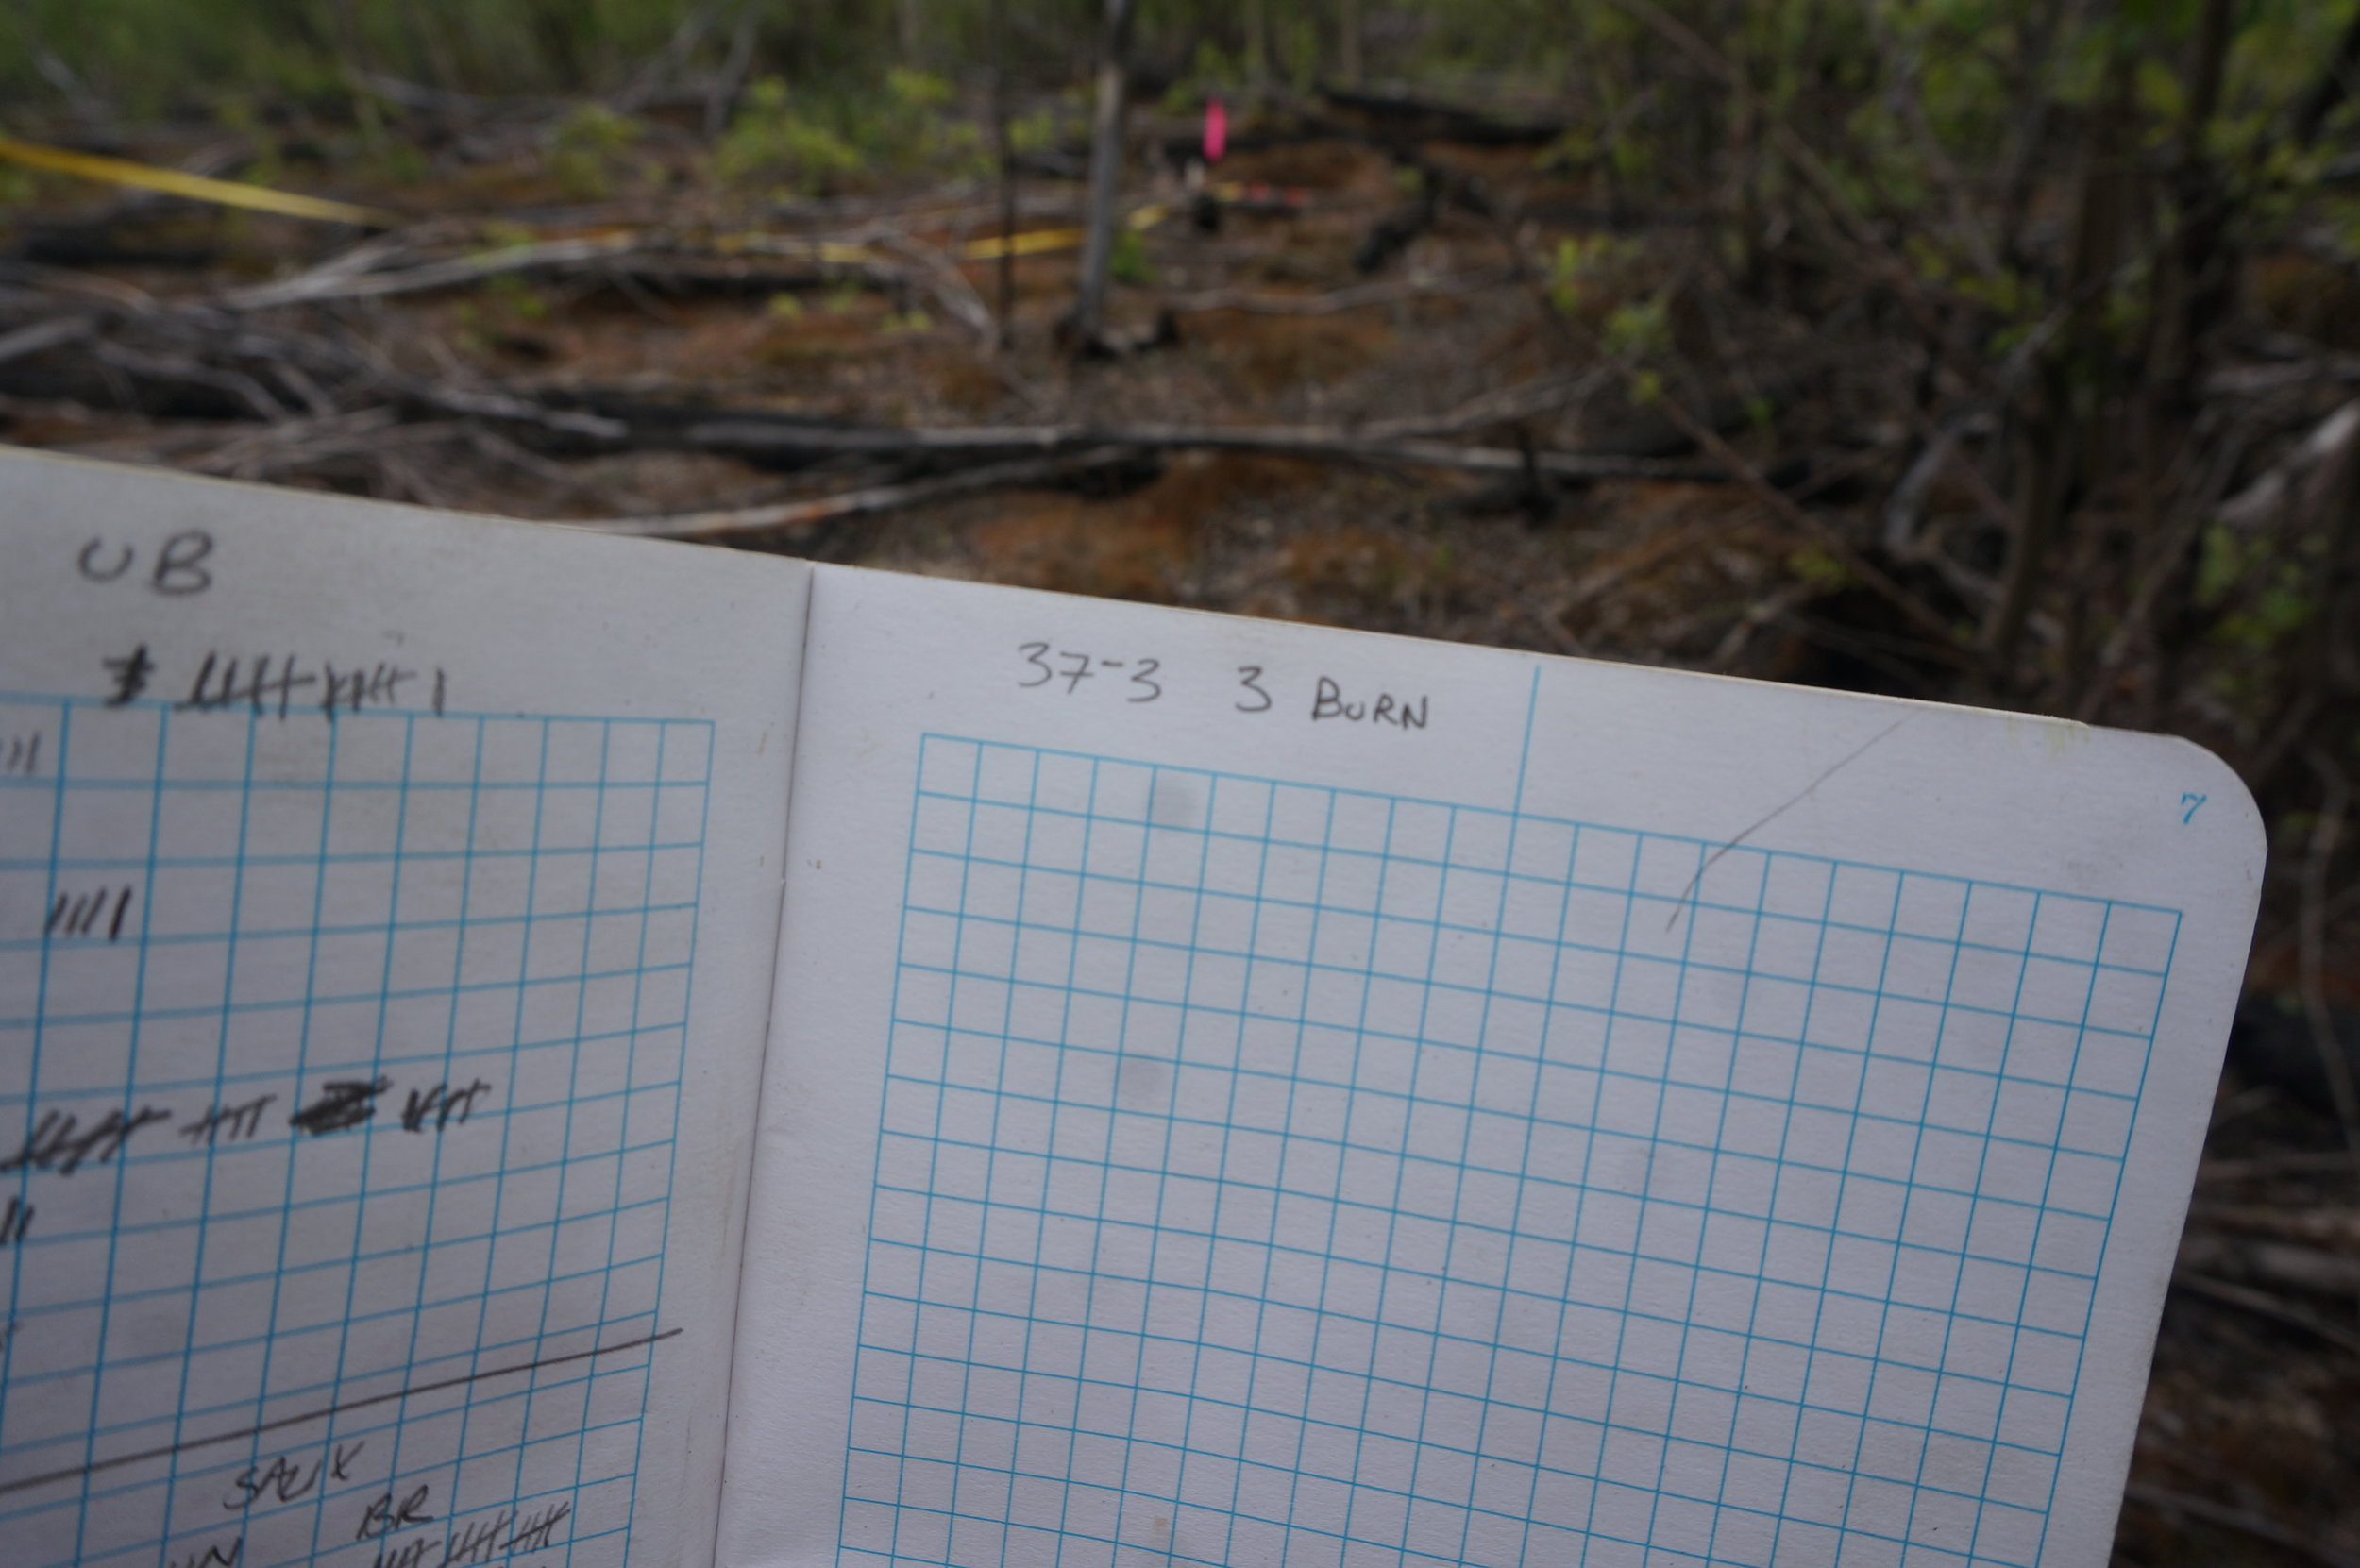
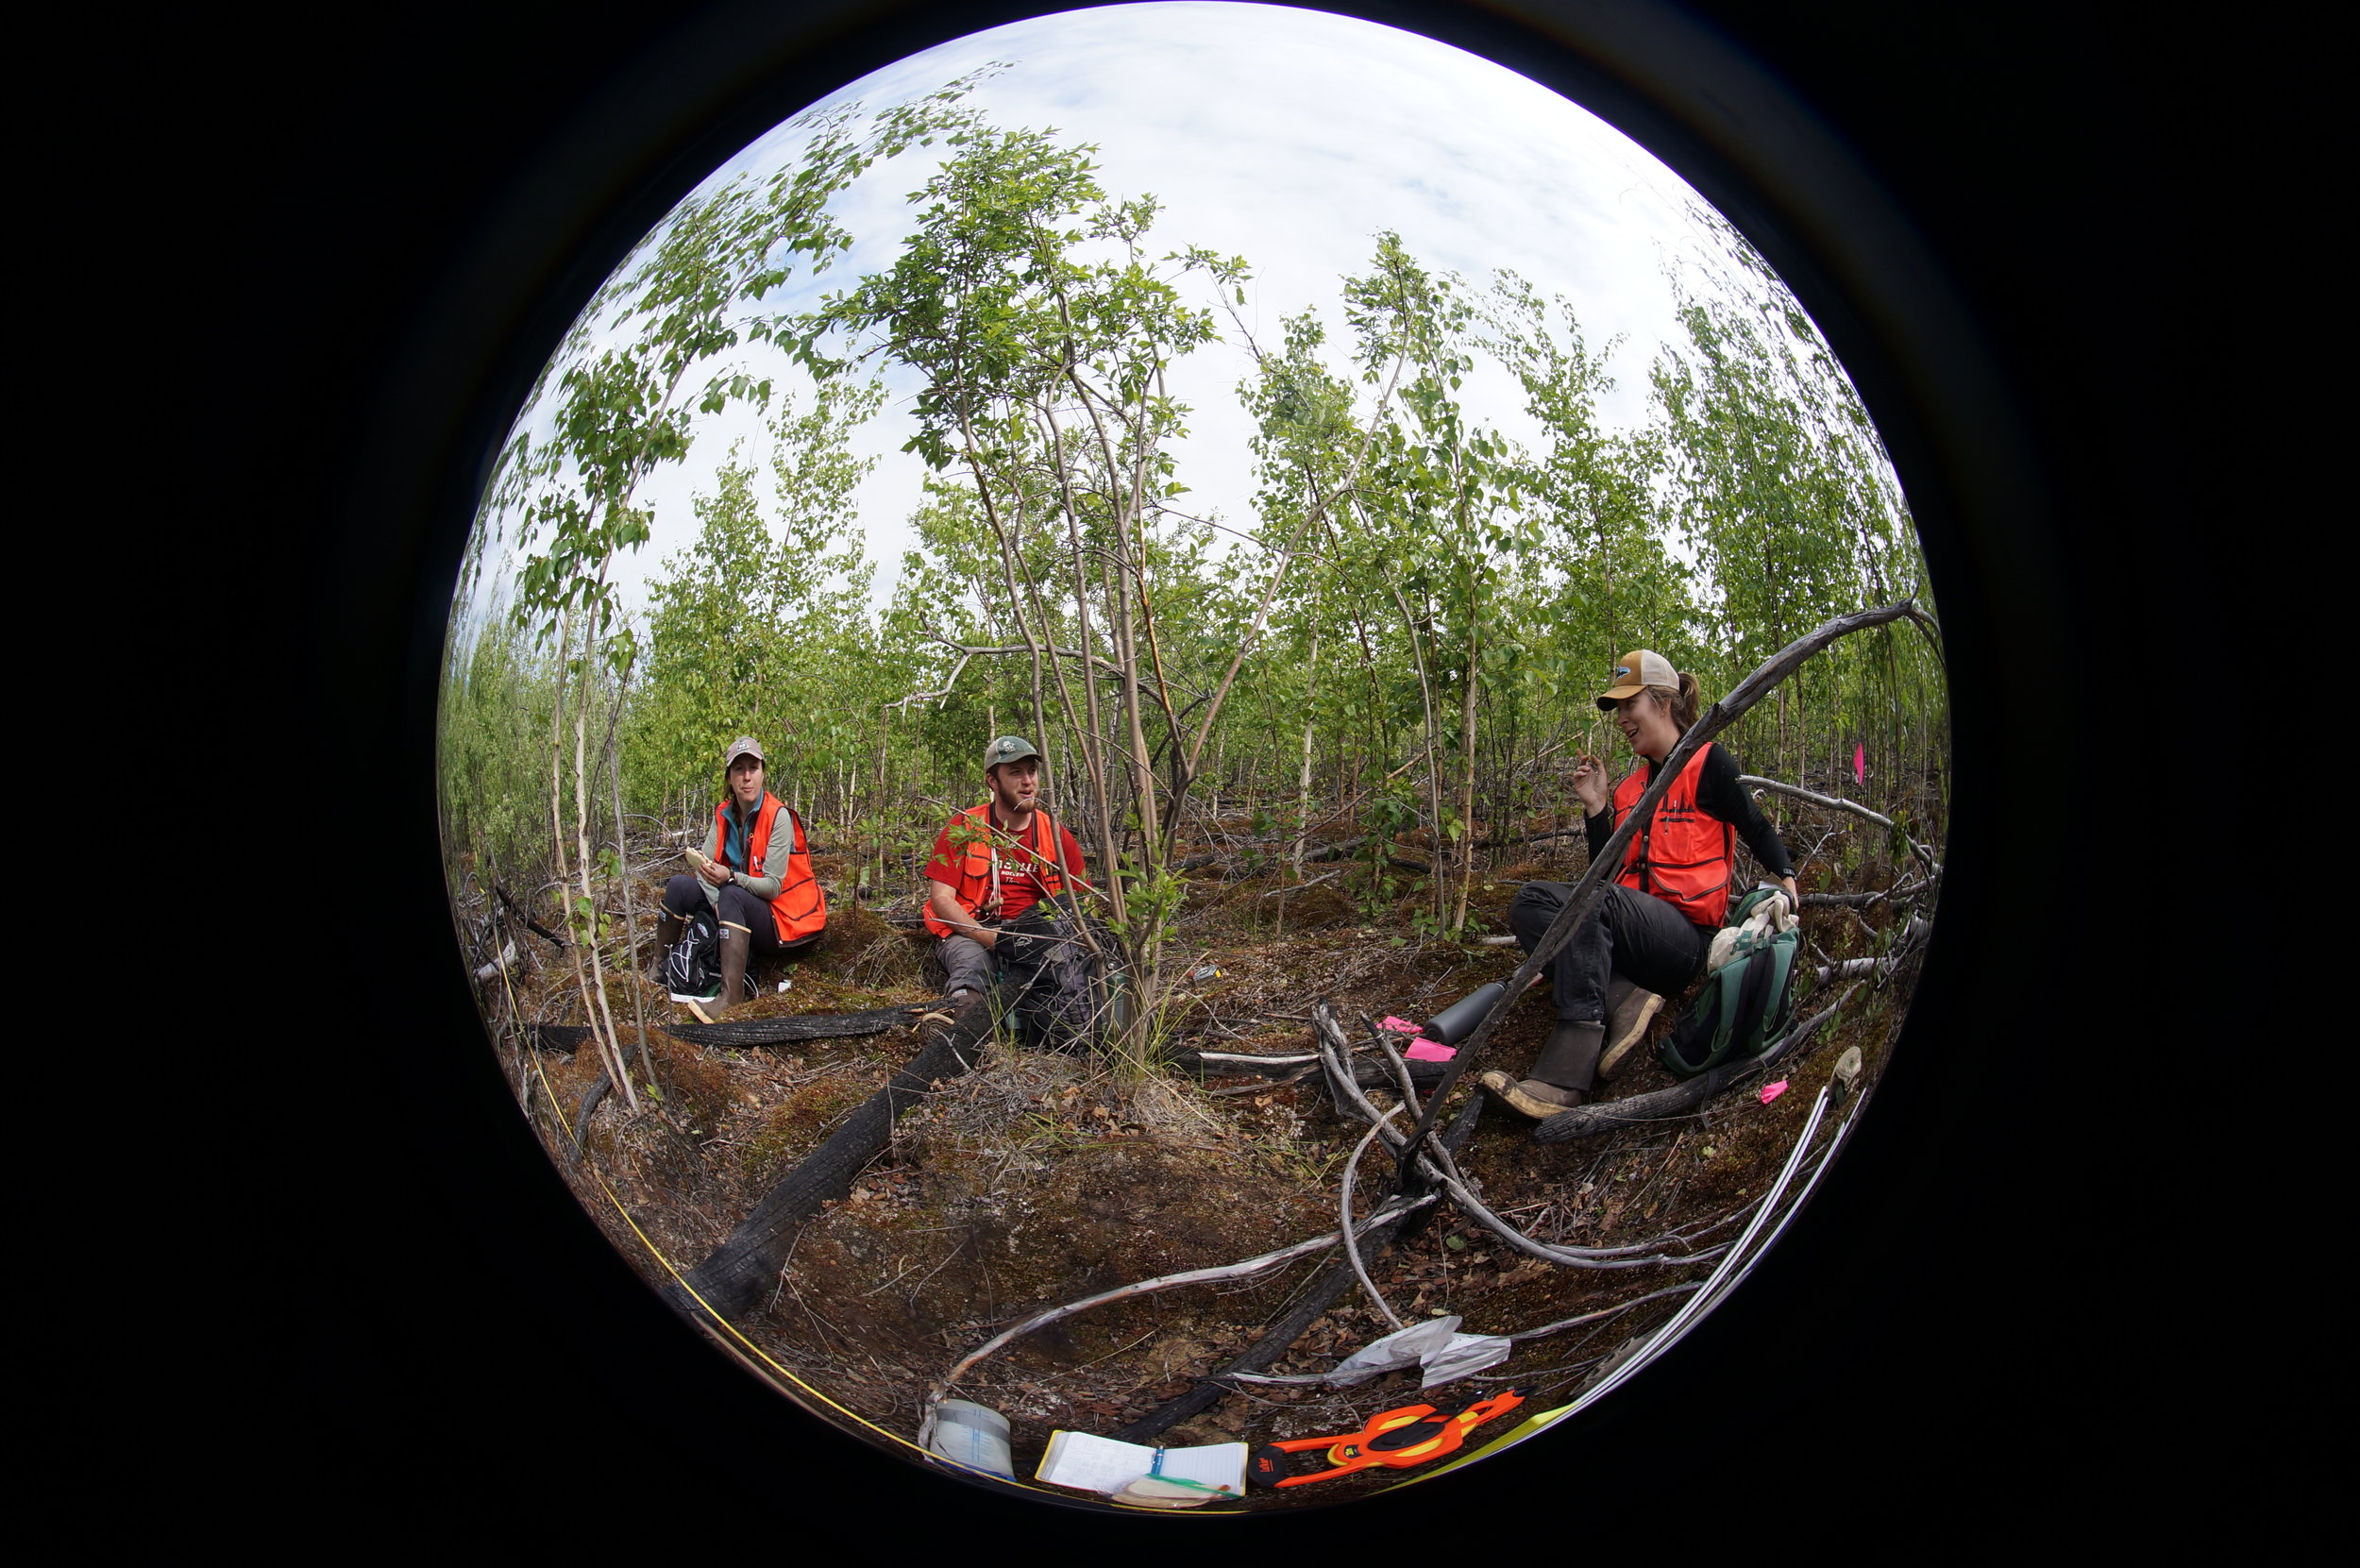
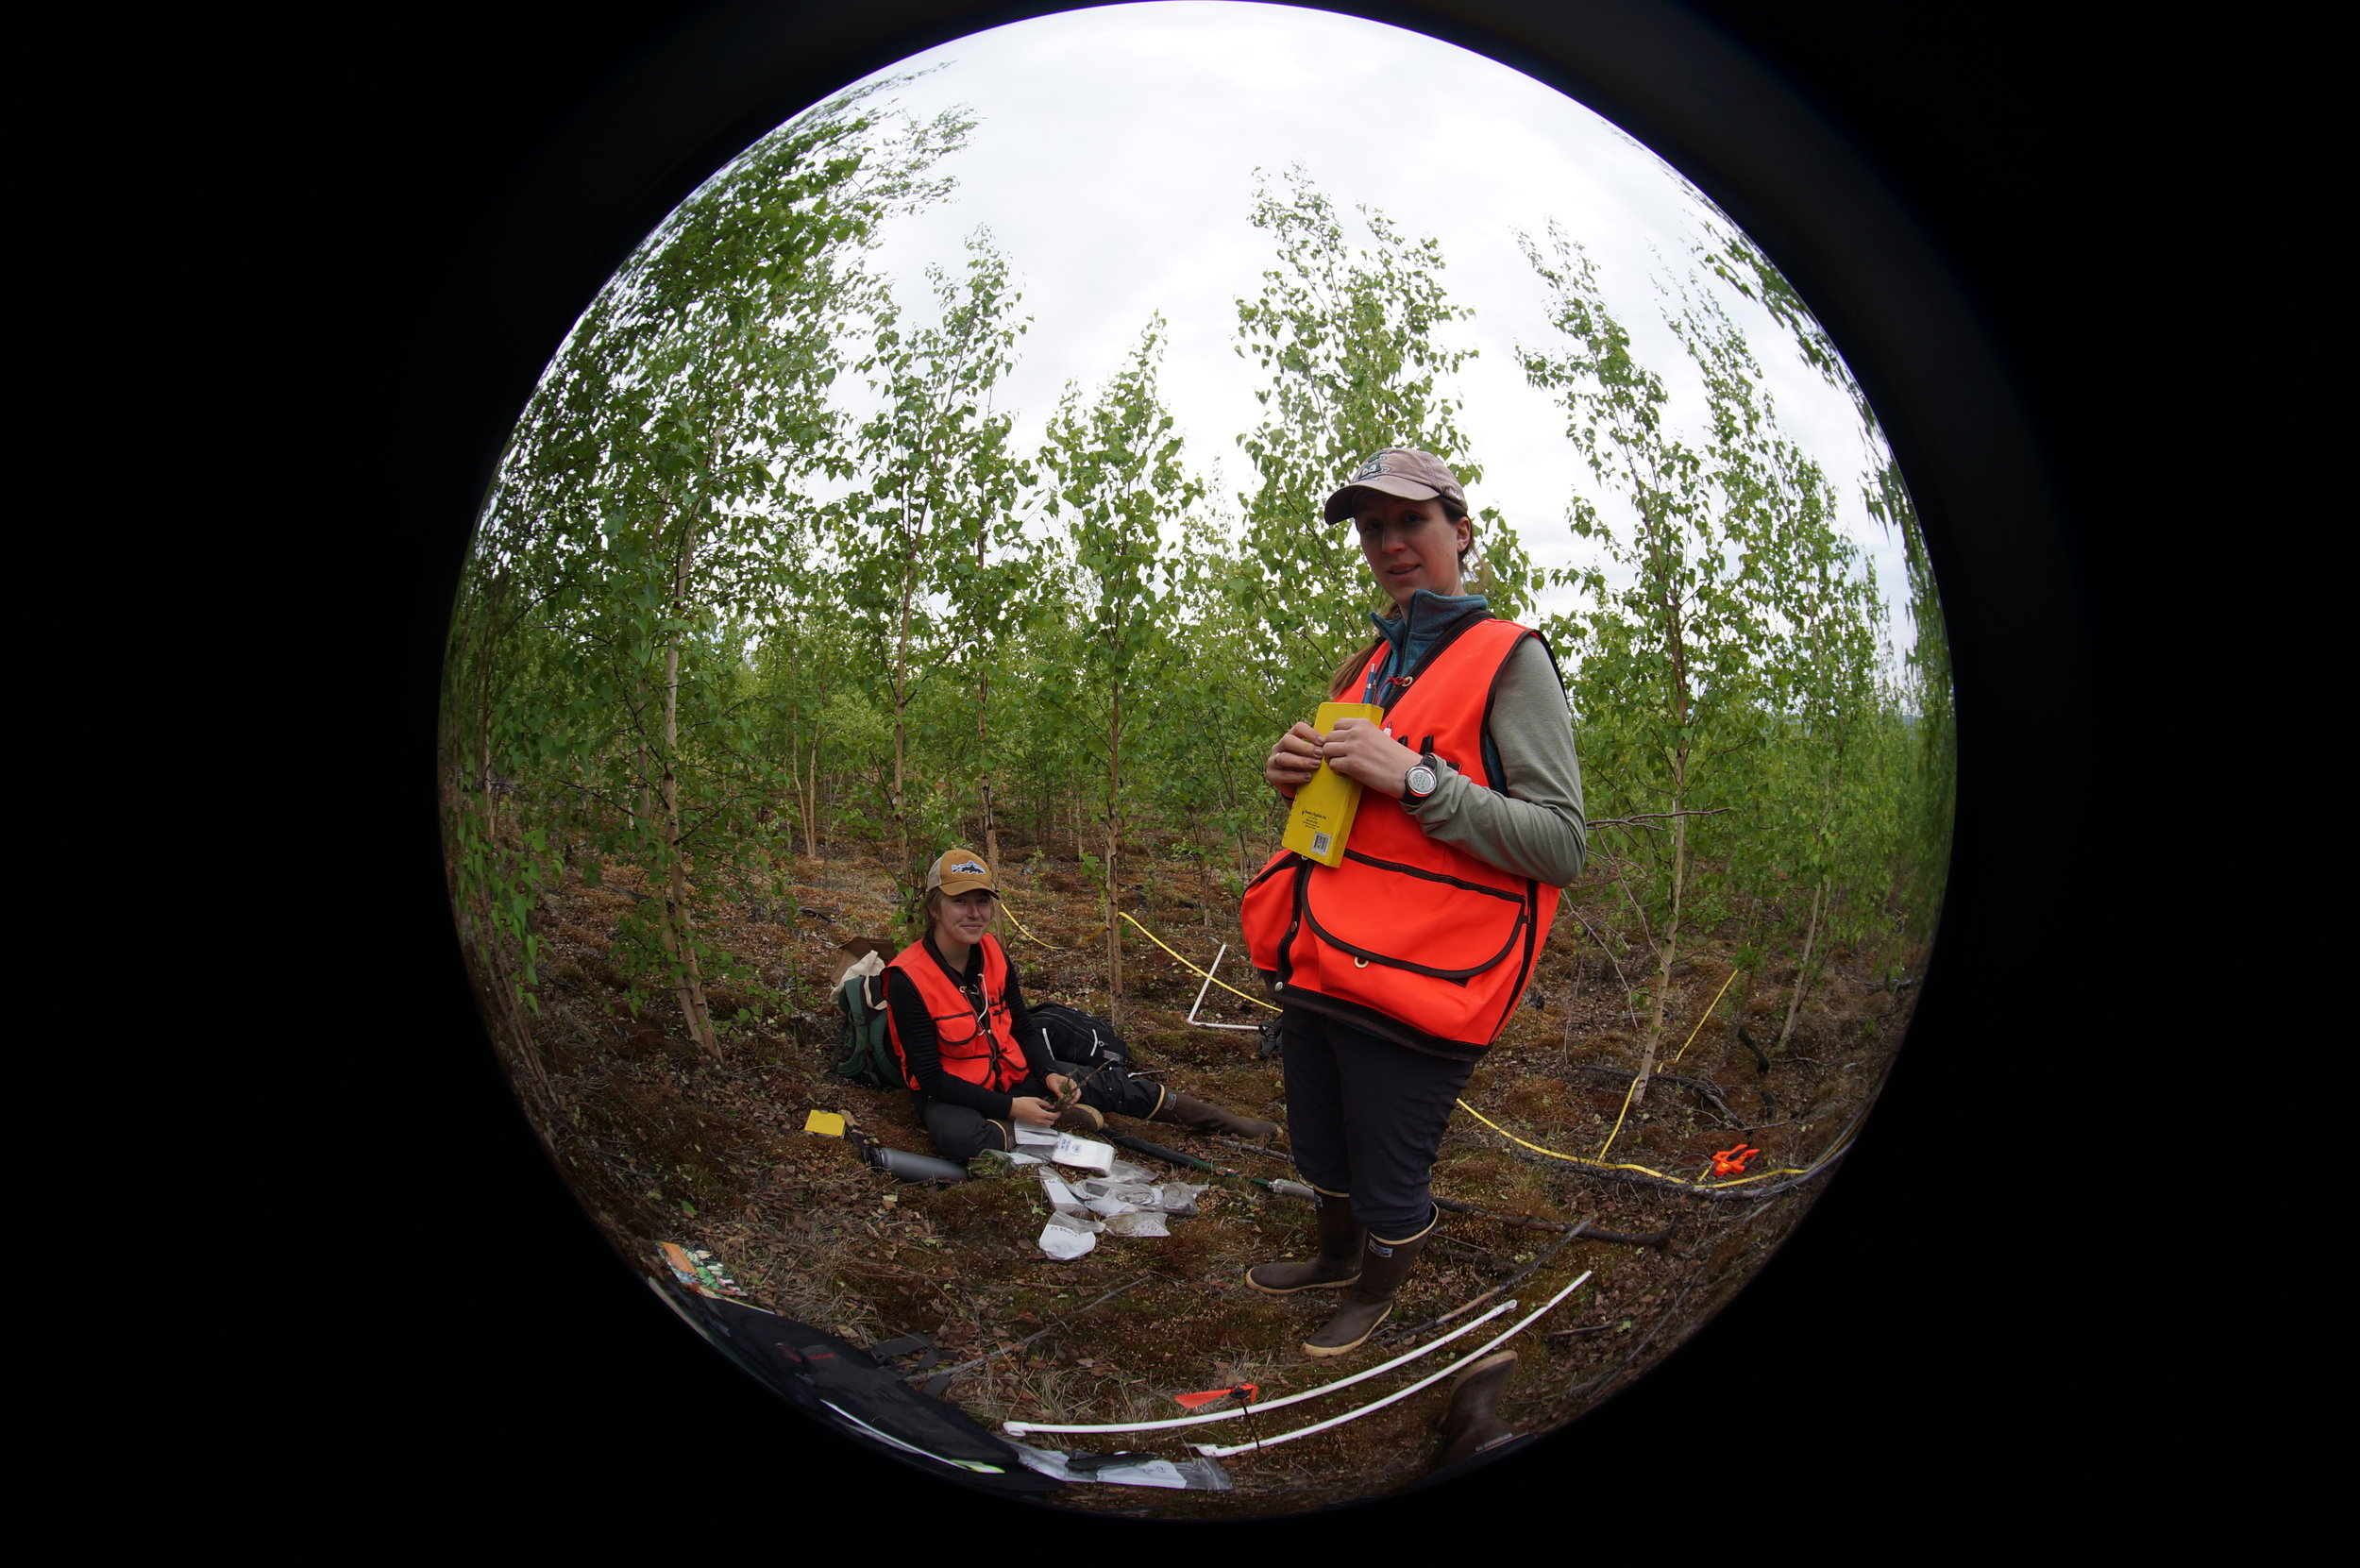
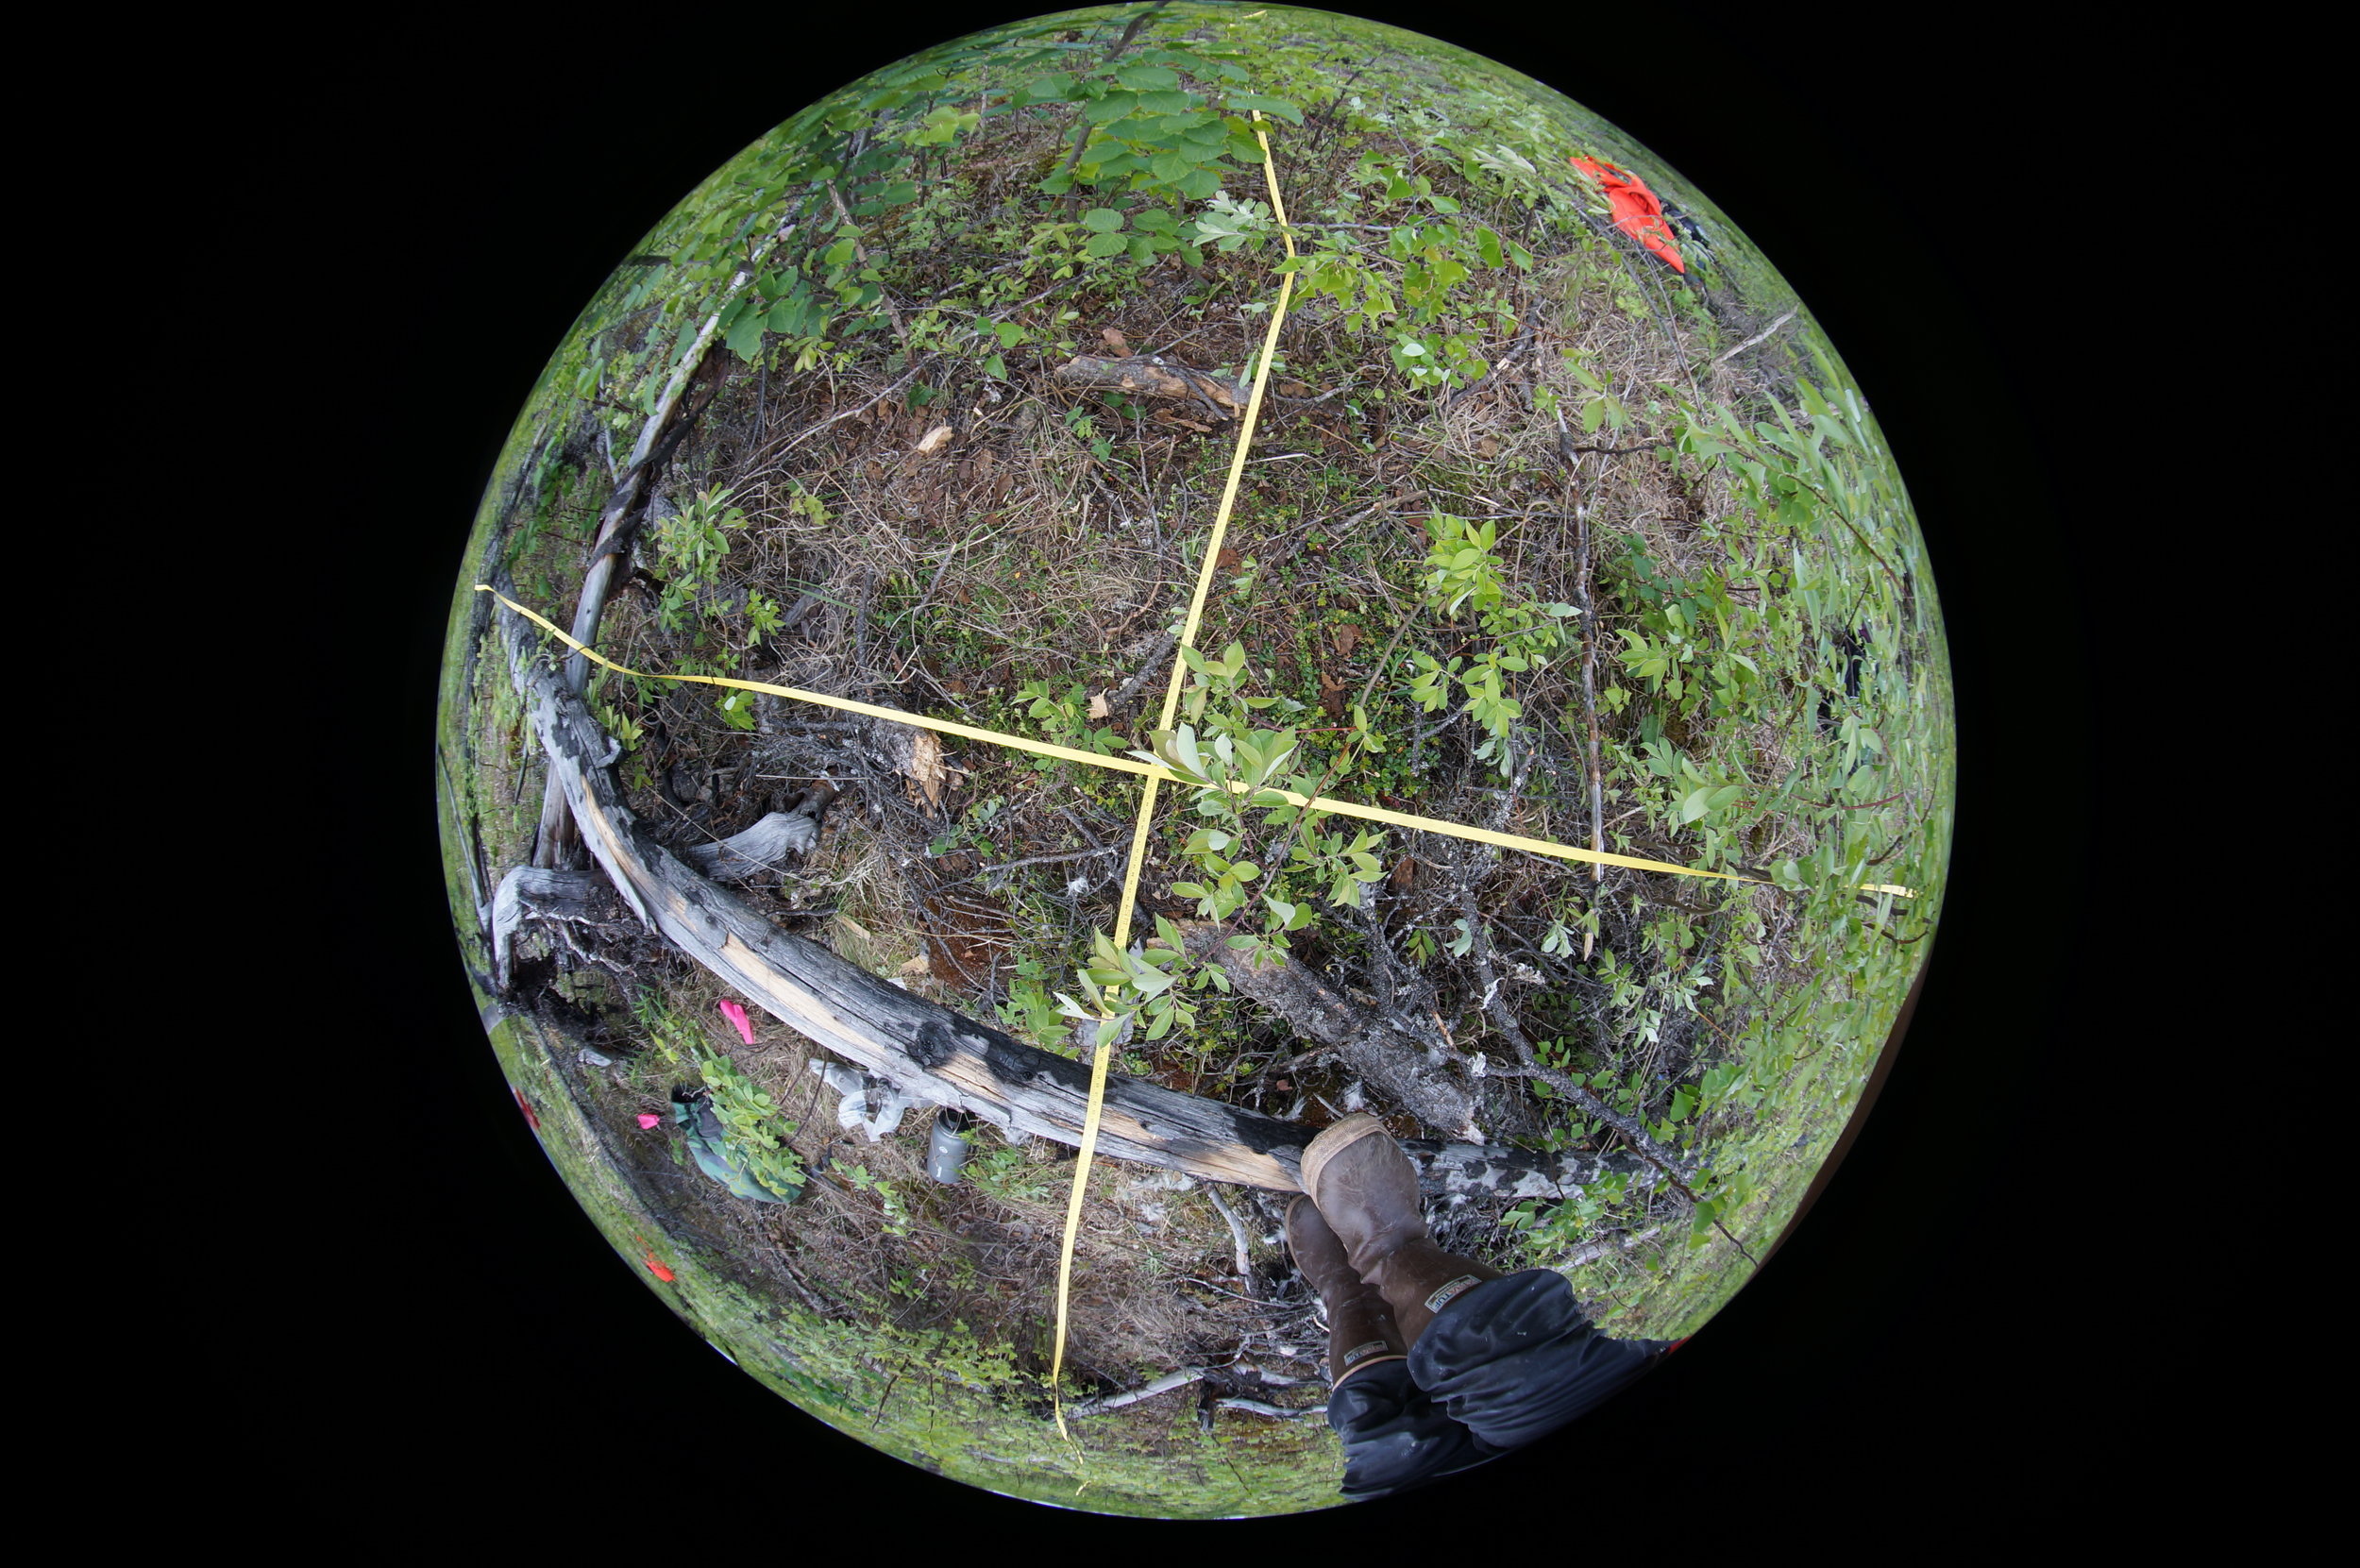
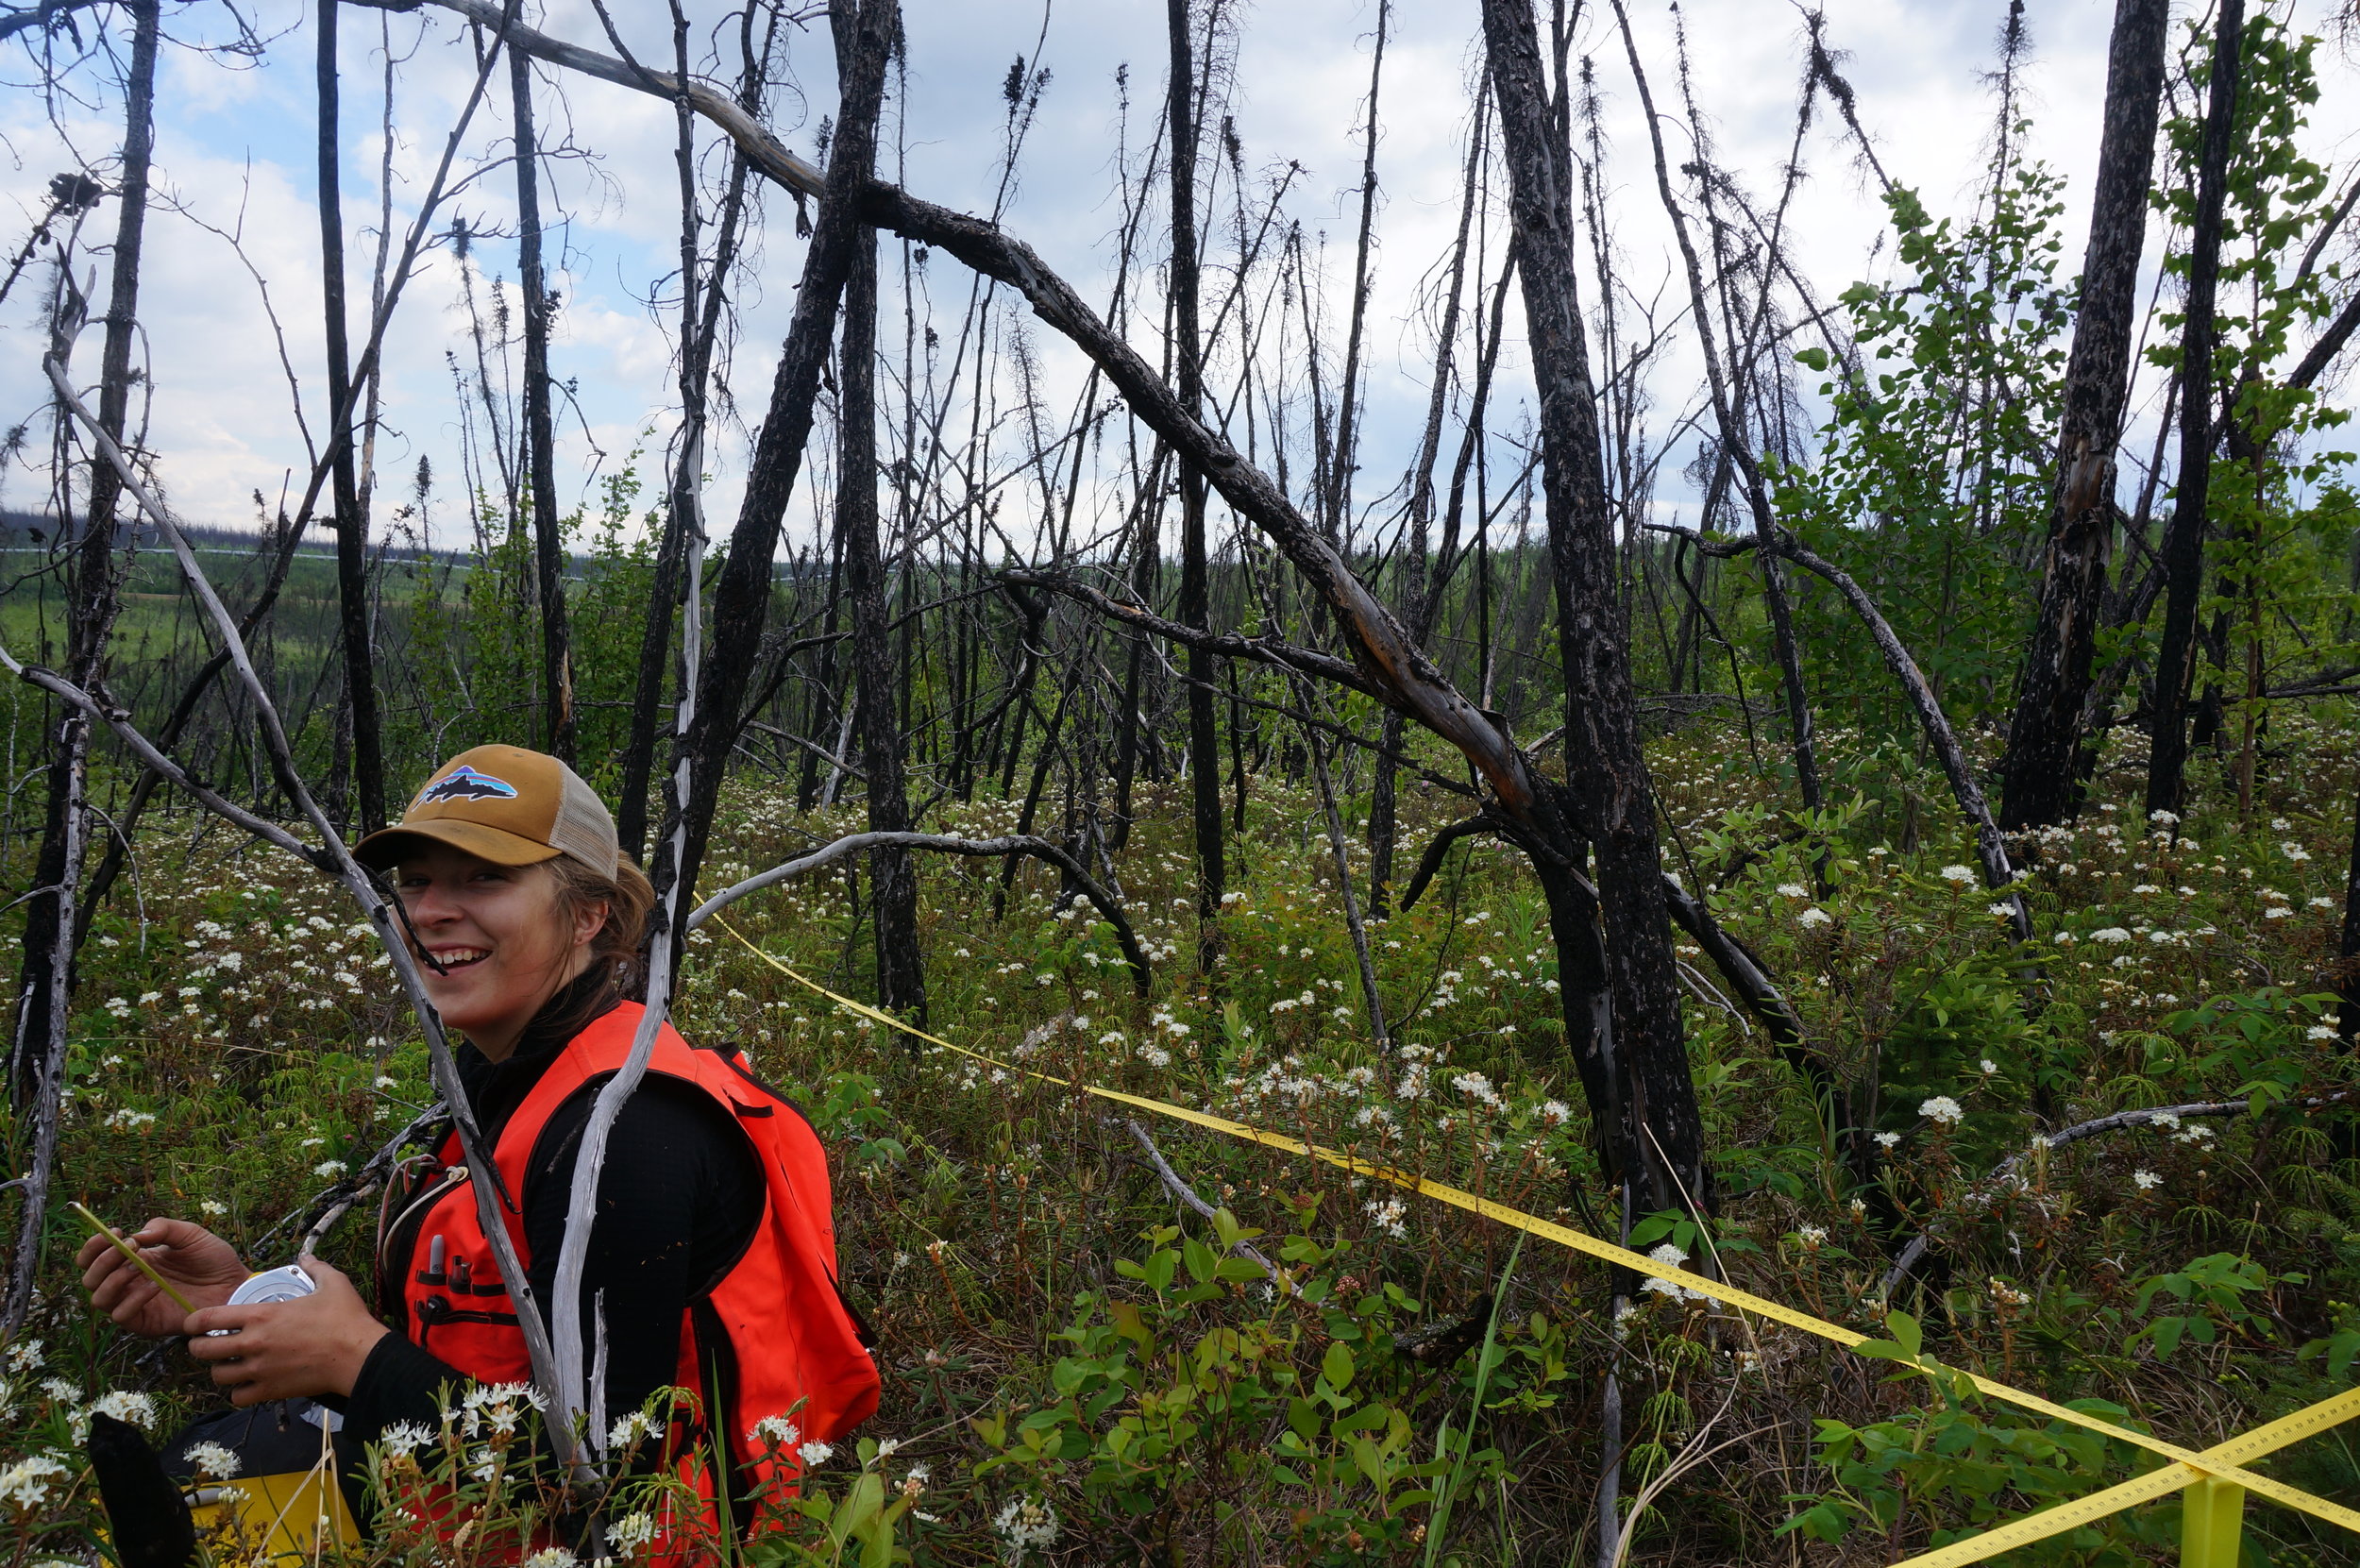
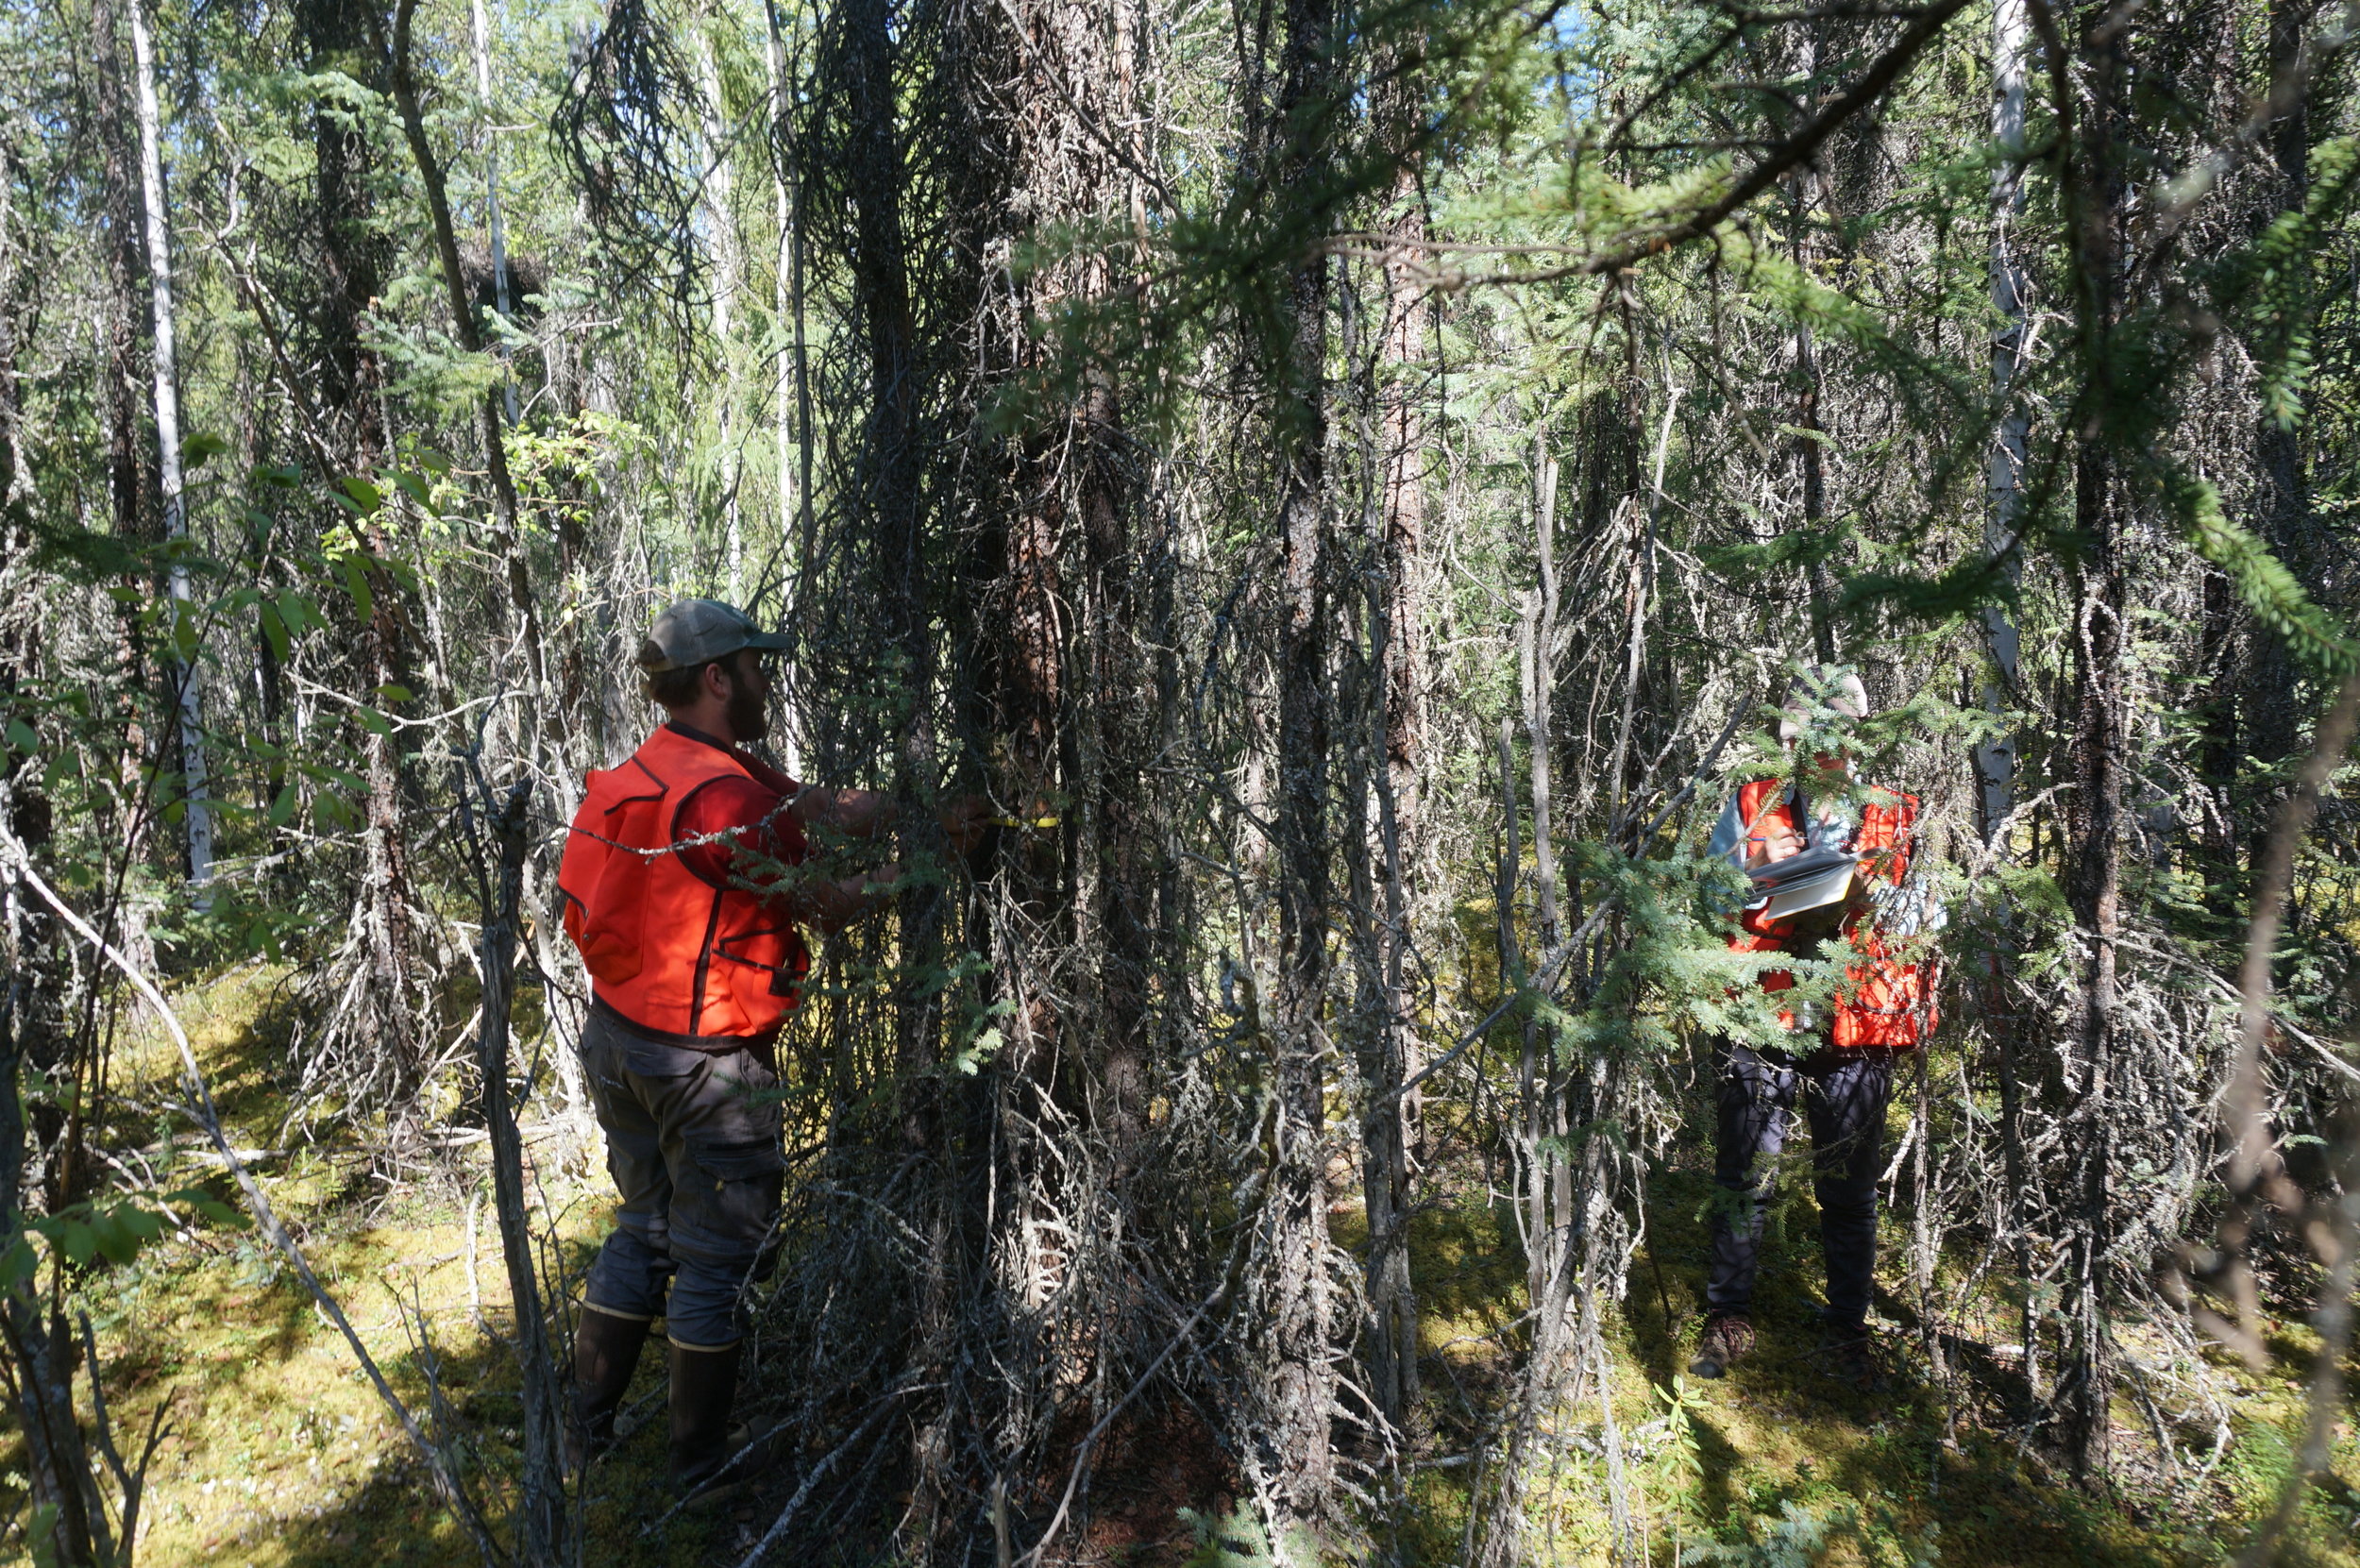
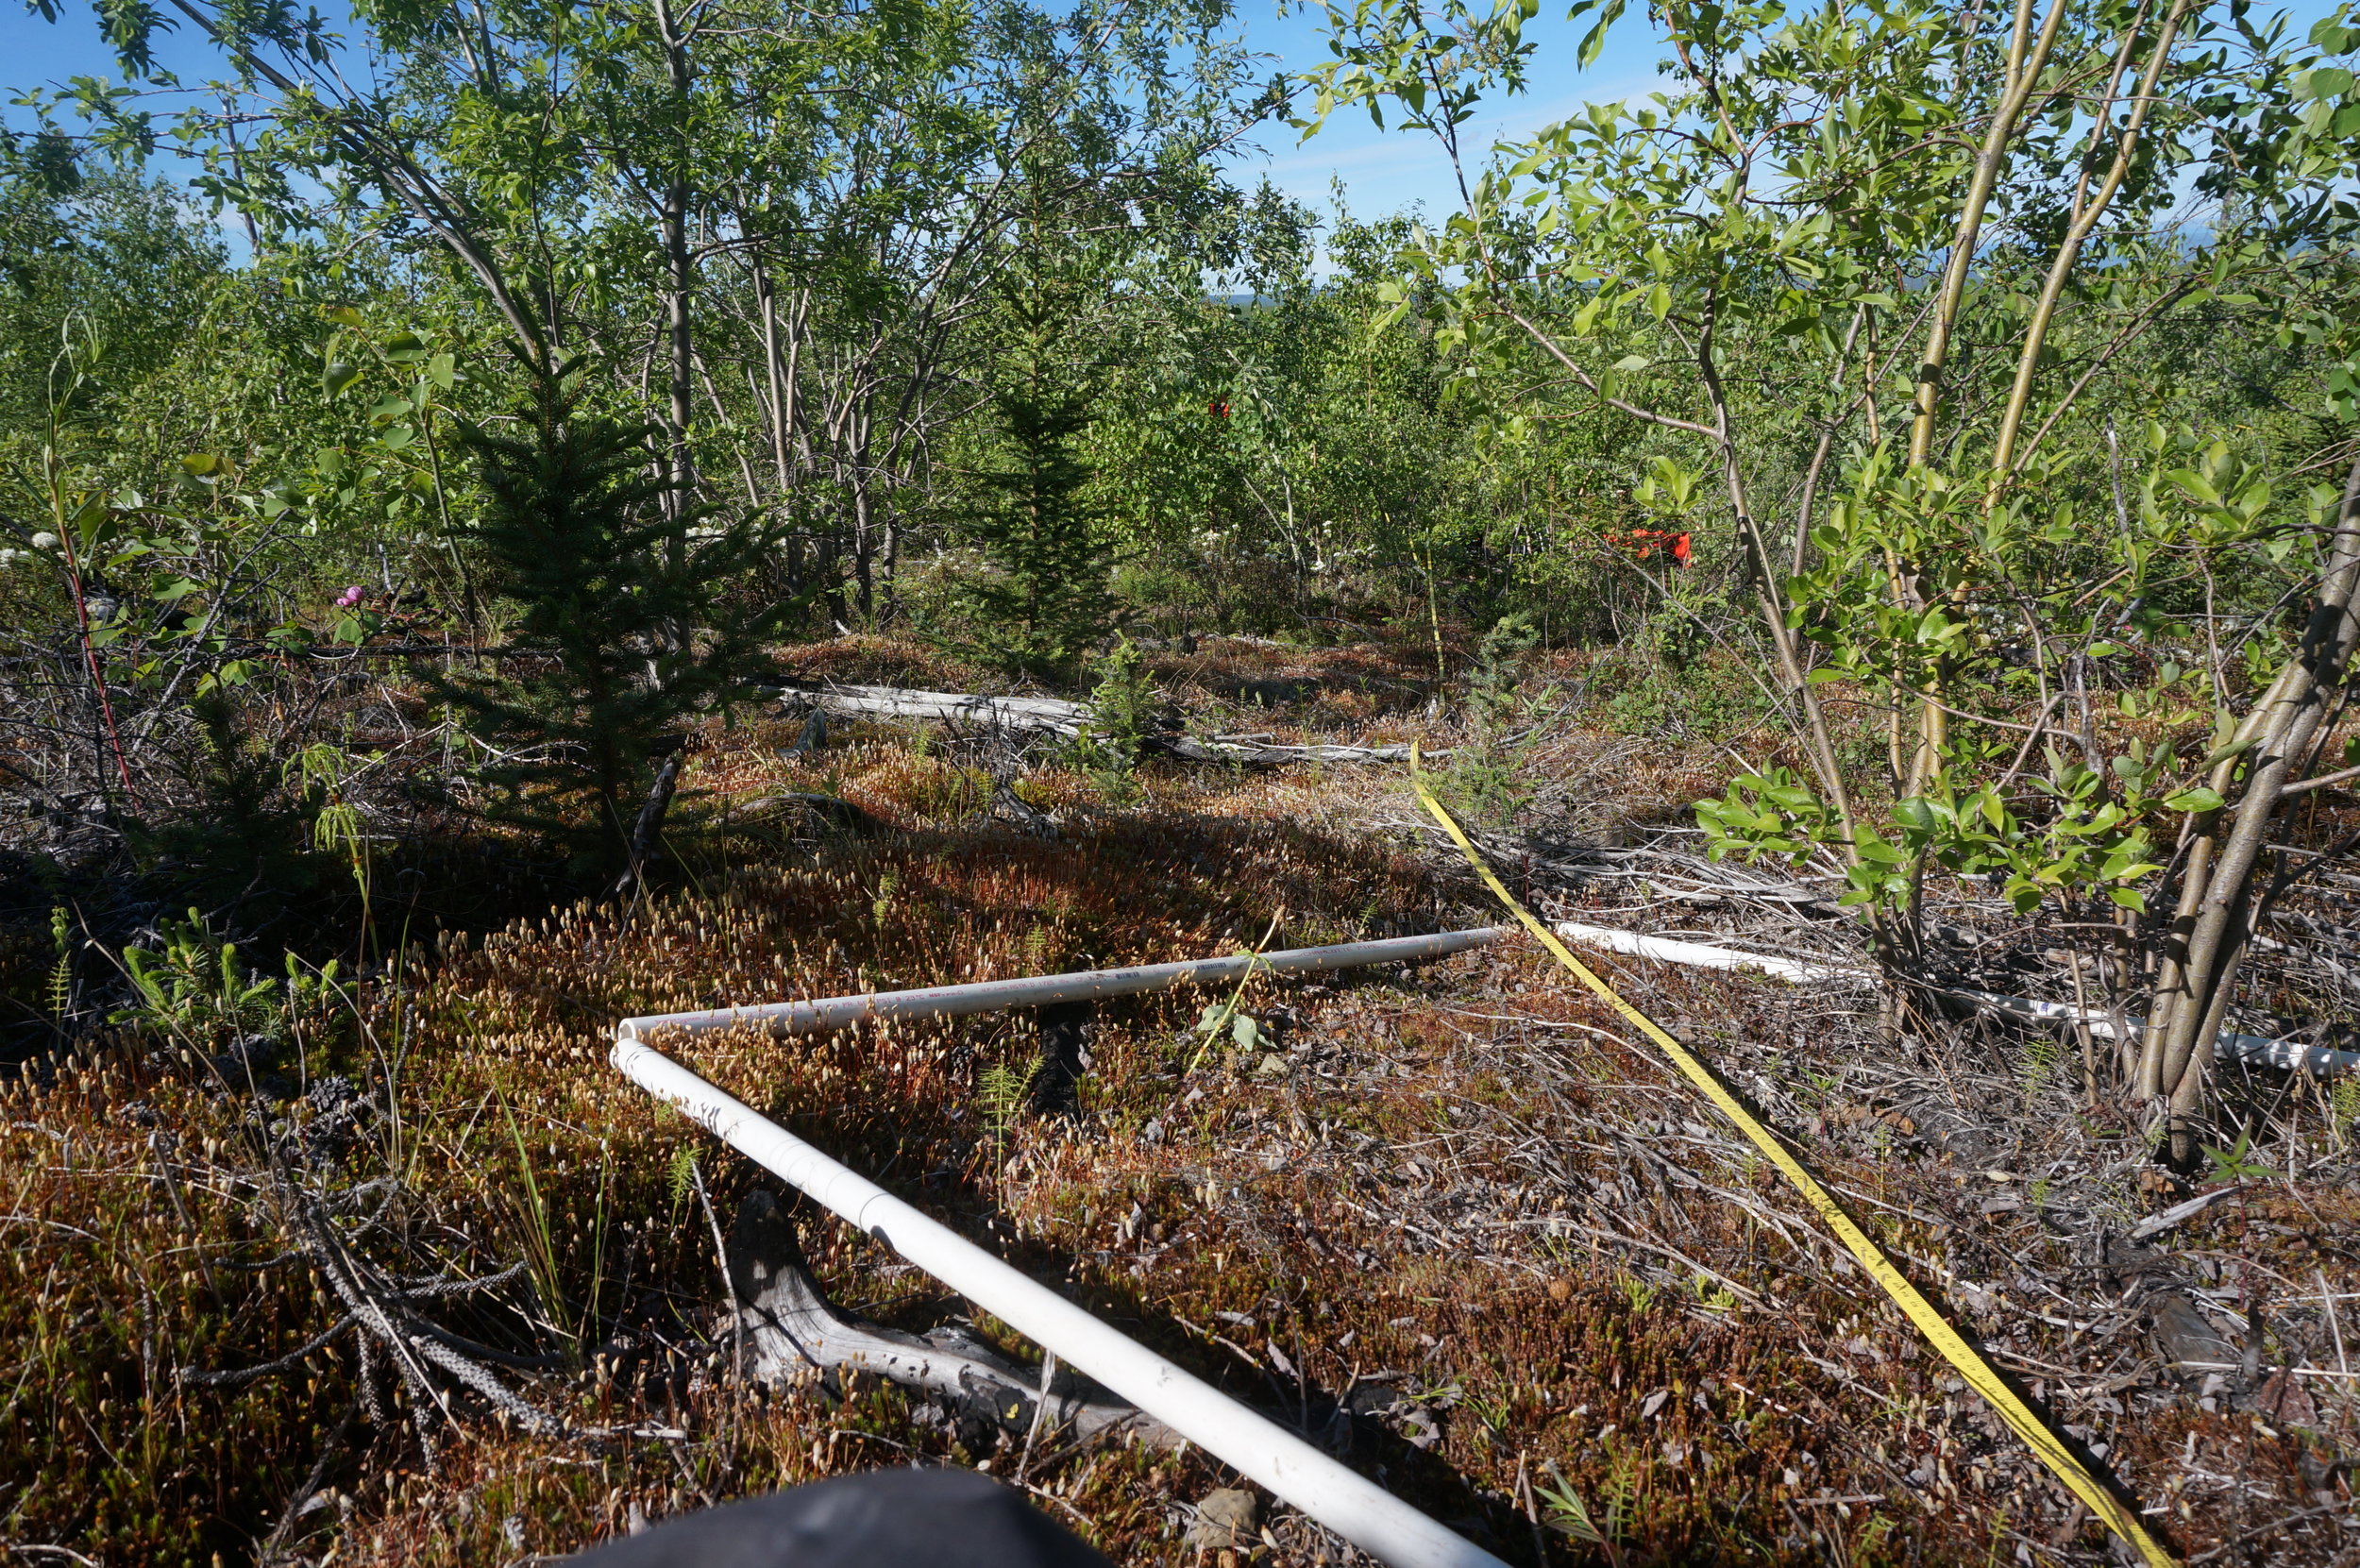


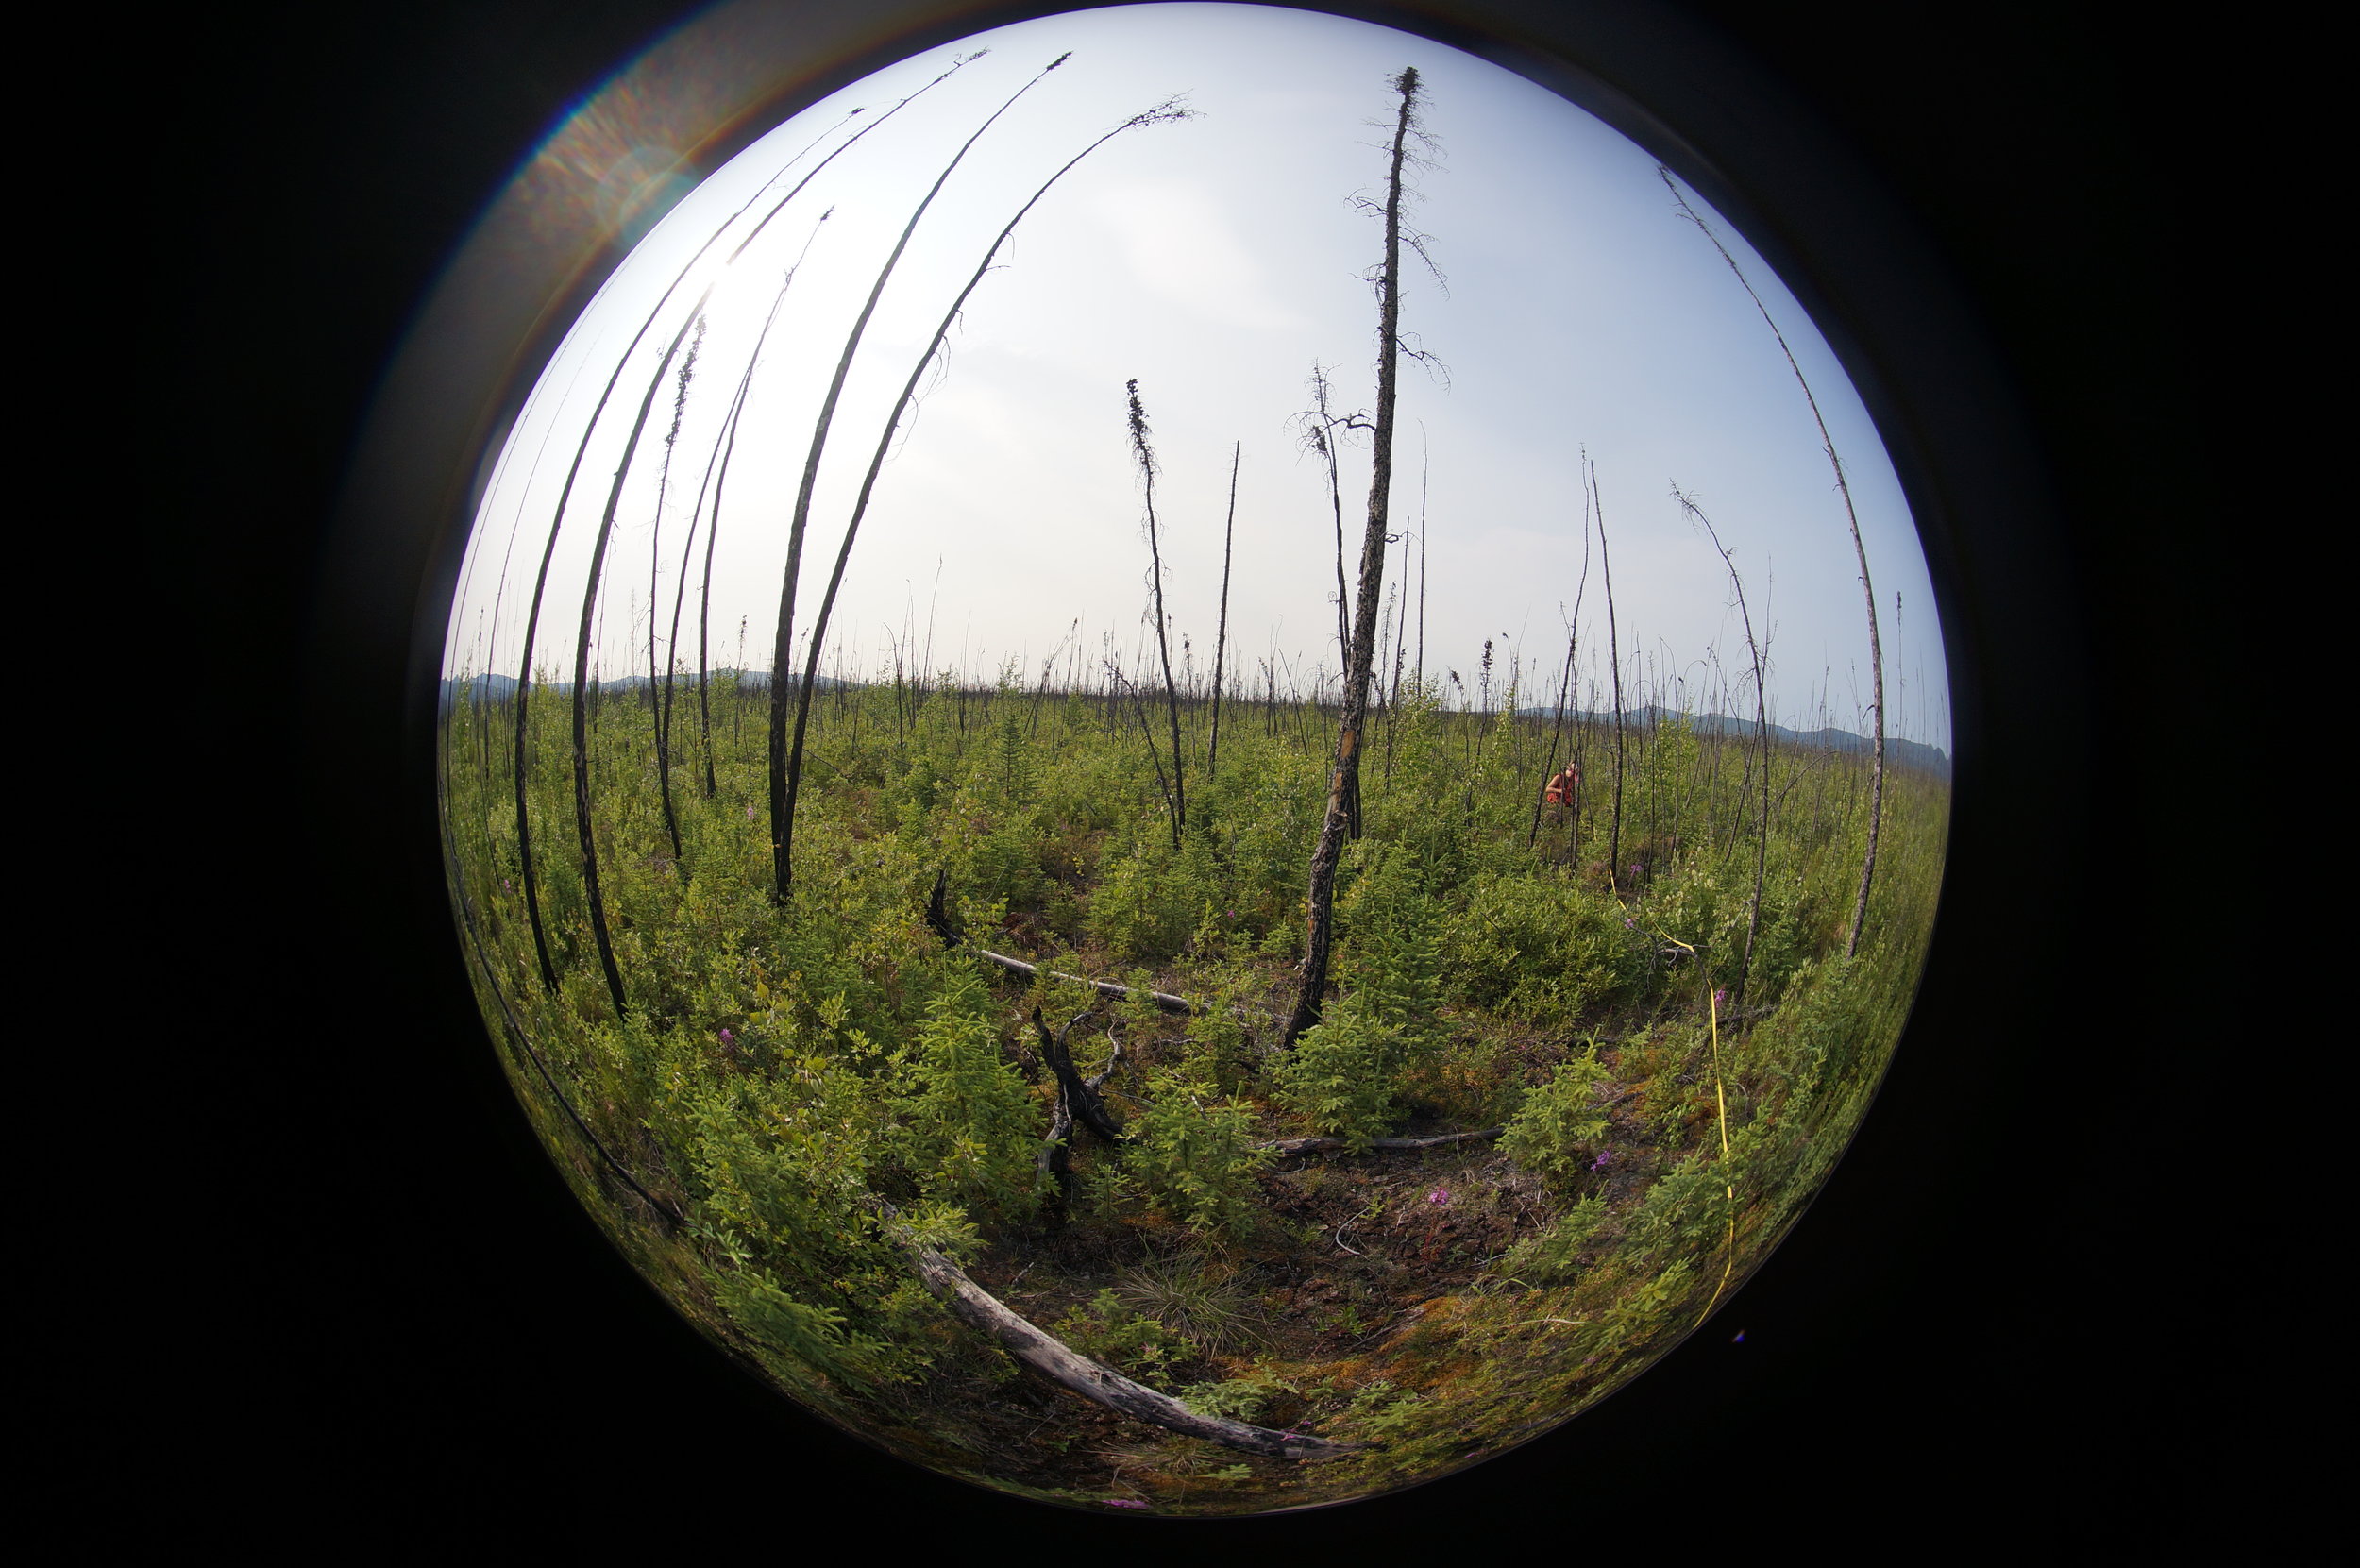
Various images from the 2017 field season in central Alaska.
Another ongoing is the role of wind, landslides, and cedar decline on regional carbon balance in southeast Alaska - an area the size of Florida that contains carbon stocks equivalent to ~8% of the lower 48 forests put together. Kyle Turchick, an MS student in the lab, is working on figuring out the role of landslides, wind, and their interactions in shaping the spatial distribution of carbon in this important carbon reserve. Together with Dr. Adam Booth (Portland State) we are also working on building a better model for predicting landslide exposure - a very important tool in this landscape, where people are occassionally killed by landslides due to the frequent heavy rains and steep topography. Working with Sitka, Alaska, we hope to better inform the community as to risks and realities of the beautiful but dangerous landscape.
Landslide susceptibility if you consider wind disturbances and cedar decline as interacting factors (left), if you don't (middle), and the difference (right). Scale goes from 0 (no chance) to 1 (100% probability). From Buma and Johnson (2015). A scaled up version of this analysis was used to map cumulative, regional exposure to landslides and wind and tie those results to regional carbon balance.
Let's go bigger!
We can go to a true "Big Data" approach by employing new technologies like Google Earth Engine, which allows us to look at broad scales and fine grains quickly and efficiently. For example, together with colleagues at NC State and the USFS, we are exploring how disturbance processes change with scale across the continent and what that means for conservation and ecosystem monitoring in different ecoregions. By combining information about the biotic communities and the pattern of disturbances, we can improve decision making processes regarding reserve design (how big is big enough?), management planning (what is the optimal size and variance in silvicultural treatments?) and climate change modeling (what's a baseline disturbance distribution?).
Differences in spatial pattern are apparent at multiple scales, from 30m pixel arrangements in a small area to big, landscape spanning shapes (>100 km2). By analyzing them simultaneously, we can extract significant amounts of new information regarding ecosystem functioning. By doing this simultaneously across the continent, a new understanding of the similarities and differences between different ecoregions emerges. Riiters, Constanza, and Buma 2017.
GIS Datasets
A variety of GIS and remote sensing datasets inform the work. The USFS has provided excellent landslide maps which have enabled us to explore how better to predict their distribution on the landscape; new remote sensing resources have allowed us to analyze forest mortality and expansion across all of southeast Alaska (currently expanding down to northern California).
Distribution of forest disturbances across southeast Alaska (anthropogenic disturbances removed) and a comparative distribution of their spatio-topographic contexts at a latitudinal scale. The analysis is conducted at the 30m scale. From Buma and Barrett 2015.
Geostatistics
Utilizing a variety of statistical analyses, we look at how disturbances are distributed across the landscape, how they interact, and how that can improve natural hazard forecasting, increase our knowledge of ecological processes, and help us monitor the effects of climate change.

Several variables interact in complex ways to shape the distribution of landslides on the Alaskan landscape. From Buma and Johnson 2015.
